In today’s world of Information Technology, it had become as difficult as it can for an IT professional to dig a particular data over the internet. Unlike old days, one cannot pinpoint the required resource with just an internet research. It is not because of the data scarcity but because of the enormous availability. It had become a challenging task to scroll down to the appropriate resource or reference.
And meanwhile, this data complexity is also a deal-breaker for the business intelligence market. The perfect solution that overcomes the data complexity wins the battle. One such provider of complex data processing engine is Tableau. It transformed the data processing methods with its fun-filled and exclusive approaches.
Data Visualizations in Tableau
The Tableau software can work affluently with data visualizations and can display the information in the most innovative way possible. One best example of such viz (data visualization in Tableau) is an effective breakdown of the details of various gadgets. Below example portrays a data chart of smartphones with their respective cost and components.
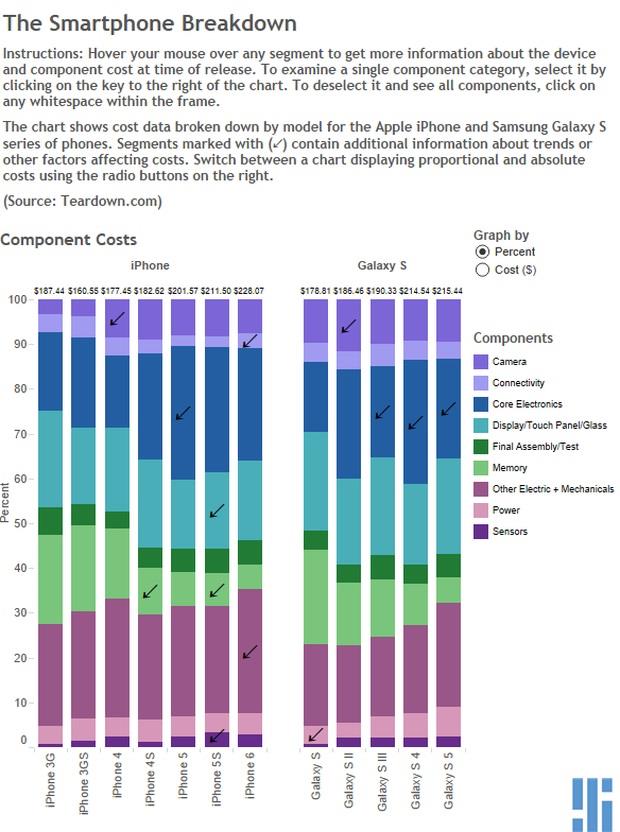
(Image : Tableau)
Not just technical details of gadgets, you can explore data on everything around the world. For instance, you can render the details of James Bond Movies and the location of each James Bond Movie.
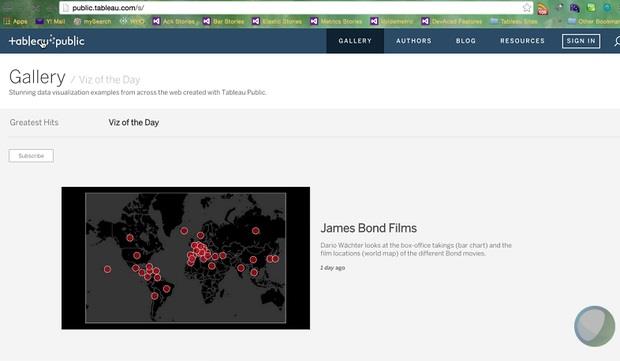
(Image : Tableau)
Tableau can perform such visualization and allows the user to manipulate, process and extract inner details of each information effectively.
Interesting. Isn’t it?
There are five different products released by Tableau to encourage the preference of the user. They are,
Tableau Desktop – it is an application which can be installed in a Windows/Mac machine. It can process the data allows the user to visualize and connect to data sources ranging from web data (such as to Twitter or Google Analytics), Excel, MySQL, financial/custom databases and Hadoop to name just a few. The cost is either $1,000 or $2,000 per license and includes one year of maintenance.
Tableau Server – It is a server system which allows several users to connect with and work on live interconnections, explore trending data, refresh displays with the latest data, schedule actions, and proxy security.
Tableau Public – It is a free online resource which provides platform for interactive data visualizations.
Tableau Online, a cloud-based offering. It can operate the server product and integrate security/data sources. It's "like Salesforce for data visualization." Cost is $500/user/year.
Vizable application – This free application is launched in October 2015 initially for the iPad device and later scattered for various other devices.
Find a course provider to learn Tableau
Java training | J2EE training | J2EE Jboss training | Apache JMeter trainingTake the next step towards your professional goals in Tableau
Don't hesitate to talk with our course advisor right now
Receive a call
Contact NowMake a call
+1-732-338-7323Take our FREE Skill Assessment Test to discover your strengths and earn a certificate upon completion.
Enroll for the next batch
Tableau Hands-on Training with Job Placement
- Jun 26 2026
- Online
Tableau Hands-on Training with Job Placement
- Jun 29 2026
- Online
Tableau Hands-on Training with Job Placement
- Jun 30 2026
- Online
Tableau Hands-on Training with Job Placement
- Jul 1 2026
- Online
Tableau Hands-on Training with Job Placement
- Jul 2 2026
- Online
Related blogs on Tableau to learn more

Is Power BI better than Tableau?
Power BI and Tableau are both leading business intelligence tools, but which one is superior? we have discussed in this blog comprehensively.
What are the core components of the Tableau interface?
Explore the core components of the Tableau interface and learn how these components interact to provide a comprehensive data analysis platform.

How can you optimize the performance of a Tableau workbook?
Optimize the performance of your Tableau workbook by following best practices for data connection, visualization, and caching.

What is Tableau certification?
Learn about Tableau certification and discover the benefits of certification, the certification process, and the skills required to pass the exam and advance your career in data analysis.
Which Tableau Certification is Best
Why considering taking Tableau Certification is crucial? In the dynamic realm of data analytics and visualization, Tableau has emerged as a frontrunner, empowering professionals to transform complex datasets into actionable insights. As the demand fo
Advanced Features of New Tableau 2019.4
Check the advanced features of the new Tableau 2019.4 Usage of tables have entered a vast customer base, considering that and to provide a better and powerful tool, the tables’ team have come up with a set of new advanced update: Wider tables: Se
Tableau sets up its hub in Delaware, will it be nationwide?
Pioneering: Tableau, sets up a higher bar in the accounting software and tools sector, recently TABLEAU has introduced its taxation and accounting tools into the lives of former prisoners of Delaware. What’s tableau: Tableau is the most powerful, s
Tableau Certification Questions and Answers Sample for Exam Practice
Tableau Exam Questions and Answers for Desktop Specialist, Desktop Qualified Associate and Desktop Certified Professionals Data skills are in very high demand in every corporate. Organizations would like to assimilate simplified versions of the data

Data Analytics and Visualization with Tableau
Big Data analytics and visualization are one of the most vital trends in Business Intelligence today. By leveraging advanced analytics, enterprises can study big data sets to gain in-depth insight into where the business stands currently, and identif

Advantages of Tableau 9 certification over conventional Business Intelligence courses
Tableau is successful software with innovative data visualization tools. If you’re looking for a solution that gives the end user the ability to generate powerful data visualization, Tableau may be a good fit. Tableau’s additional benefits include a
Latest blogs on technology to explore

Drug Safety & Pharmacovigilance: Your 2026 Career Passport to a Booming Healthcare Industry!
Why This Course Is the Hottest Ticket for Science Grads & Healthcare Pros (No Lab Coat Required!)" The Exploding Demand for Drug Safety Experts "Did you know? The global pharmacovigilance market is set to hit $12.5B by 2026 (Grand View Research, 202

Launch Your Tech Career: Why Mastering AWS Foundation is Your Golden Ticket in 2026
There’s one skill that can open all those doors — Amazon Web Services (AWS) Foundation

Data Science in 2026: The Hottest Skill of the Decade (And How Sulekha IT Services Helps You Master It!)
Data Science: The Career that’s everywhere—and Nowhere Near Slowing Down "From Netflix recommendations to self-driving cars, data science is the secret sauce behind the tech you use every day. And here’s the kicker: The U.S. alone will have 11.5 mill
Salesforce Admin in 2026: The Career Goldmine You Didn’t Know You Needed (And How to Break In!)
The Salesforce Boom: Why Admins Are in Crazy Demand "Did you know? Salesforce is the 1 CRM platform worldwide, used by 150,000+ companies—including giants like Amazon, Coca-Cola, and Spotify (Salesforce, 2025). And here’s the kicker: Every single one

Python Power: Why 2026 Belongs to Coders Who Think in Python
If the past decade was about learning to code, the next one is about coding smarter. And in 2026, the smartest move for any IT enthusiast is learning Python — the language that powers AI models, automates the web, and drives data decisions across ind

The Tableau Revolution of 2025
"In a world drowning in data, companies aren’t just looking for analysts—they’re hunting for storytellers who can turn numbers into decisions. Enter Tableau, the #1 data visualization tool used by 86% of Fortune 500 companies (Tableau, 2024). Whether

From Student to AI Pro: What Does Prompt Engineering Entail and How Do You Start?
Explore the growing field of prompt engineering, a vital skill for AI enthusiasts. Learn how to craft optimized prompts for tools like ChatGPT and Gemini, and discover the career opportunities and skills needed to succeed in this fast-evolving indust
How Security Classification Guides Strengthen Data Protection in Modern Cybersecurity
A Security Classification Guide (SCG) defines data protection standards, ensuring sensitive information is handled securely across all levels. By outlining confidentiality, access controls, and declassification procedures, SCGs strengthen cybersecuri

Artificial Intelligence – A Growing Field of Study for Modern Learners
Artificial Intelligence is becoming a top study choice due to high job demand and future scope. This blog explains key subjects, career opportunities, and a simple AI study roadmap to help beginners start learning and build a strong career in the AI

Java in 2026: Why This ‘Old’ Language Is Still Your Golden Ticket to a Tech Career (And Where to Learn It!
Think Java is old news? Think again! 90% of Fortune 500 companies (yes, including Google, Amazon, and Netflix) run on Java (Oracle, 2025). From Android apps to banking systems, Java is the backbone of tech—and Sulekha IT Services is your fast track t