
Are your Tableau workbooks feeling sluggish? You've come to the right place if you want to rev up the performance and make your visualizations zip along. Like a finely tuned engine, optimizing a Tableau workbook's performance involves strategies and tricks that can supercharge your data-driven creations. This blog explores how to fine-tune your data sources, streamline your worksheets, and turbocharge your dashboards for a smoother and more efficient user experience.
Optimizing the performance of a Tableau workbook involves several strategies and techniques aimed at improving the speed, responsiveness, and efficiency of your visualizations. To learn more about Tableau workbooks and how to effectively create and analyze data visualizations, consider joining a Tableau training program. These courses provide in-depth instruction and hands-on experience with the software's features and functionality.
Here are some steps you can take to optimize the performance of your Tableau workbook:
1. Data Source Optimization
Link via data extracts (hyper) rather than directly to the data source when possible. The efficiency of queries can be significantly increased using extracts.
Lessen the amount of data being transferred to Tableau by filtering the data at the data source level.
Use incremental extraction when working with enormous datasets that only need to be fully refreshed sometimes.
Before importing data into Tableau, aggregate it at the source.
2. Data Modeling
Reduce the number of calculations and joins by optimizing your data model. Make your model simpler whenever possible.
To avoid performance lags, try to use only a few computed fields. Consider making calculated fields at the data source level and only use them when necessary.
Avoid using data densification techniques excessively because they can make the data model more complex.
3. Worksheet Optimization
Only include the worksheets and dashboards that are necessary in your workbook. Extra sheets may affect performance.
A dashboard's load time can be slowed if fewer rapid filters and parameters are used.
Reduce the number of floating items and intricate layout structures because these can hinder rendering.
4. Filter Optimization
Reduce the quantity of information used in calculations by using context filters.
Before importing data into Tableau, use data source filters to remove any extra information.
5. Calculation Optimization
Utilize effective formulas and aggregations to improve your calculated fields. The worksheet could lag when performing complicated computations.
LOD (Level of Detail) computations should only be used when necessary.
6. Parameter Usage
Limit parameters, particularly involving intricate calculations or substantial amounts of data.
7. Use Extract Filters
To minimize the quantity of data that needs to be placed into memory, apply filters to data extracts.
8. Use Aggregation
To lessen the granularity of the data, use aggregated metrics rather than specific ones whenever possible.
9. Optimize Maps
For optimal efficiency while using maps, reduce the number of data points presented and use grouping or aggregation.
10. Dashboard Design
A single dashboard should include only a few visuals or filters.
Avoid using floating elements as much as possible, and efficiently align and arrange your dashboard.
11. Testing and Profiling
Utilize Tableau's performance recorder and other profiling tools to regularly test your workbook's performance—spot improvement opportunities and bottlenecks.
12. Hardware and Infrastructure
Verify that the hardware and infrastructure supporting Tableau Server or Tableau Online satisfy the advised performance standards.
Remember that each worksheet is distinct, and your data, calculations, and visualizations should be optimized for their unique qualities. Regular testing and profiling are essential for locating and resolving performance issues as your workbook develops.
Find a course provider to learn Tableau
Java training | J2EE training | J2EE Jboss training | Apache JMeter trainingTake the next step towards your professional goals in Tableau
Don't hesitate to talk with our course advisor right now
Receive a call
Contact NowMake a call
+1-732-338-7323Take our FREE Skill Assessment Test to discover your strengths and earn a certificate upon completion.
Enroll for the next batch
Tableau Hands-on Training with Job Placement
- Jun 1 2026
- Online
Tableau Hands-on Training with Job Placement
- Jun 2 2026
- Online
Tableau Hands-on Training with Job Placement
- Jun 3 2026
- Online
Tableau Hands-on Training with Job Placement
- Jun 4 2026
- Online
Tableau Hands-on Training with Job Placement
- Jun 5 2026
- Online
Related blogs on Tableau to learn more

Is Power BI better than Tableau?
Power BI and Tableau are both leading business intelligence tools, but which one is superior? we have discussed in this blog comprehensively.

What are the core components of the Tableau interface?
Explore the core components of the Tableau interface and learn how these components interact to provide a comprehensive data analysis platform.

What is Tableau certification?
Learn about Tableau certification and discover the benefits of certification, the certification process, and the skills required to pass the exam and advance your career in data analysis.

Which Tableau Certification is Best
Why considering taking Tableau Certification is crucial? In the dynamic realm of data analytics and visualization, Tableau has emerged as a frontrunner, empowering professionals to transform complex datasets into actionable insights. As the demand fo
Advanced Features of New Tableau 2019.4
Check the advanced features of the new Tableau 2019.4 Usage of tables have entered a vast customer base, considering that and to provide a better and powerful tool, the tables’ team have come up with a set of new advanced update: Wider tables: Se
Tableau sets up its hub in Delaware, will it be nationwide?
Pioneering: Tableau, sets up a higher bar in the accounting software and tools sector, recently TABLEAU has introduced its taxation and accounting tools into the lives of former prisoners of Delaware. What’s tableau: Tableau is the most powerful, s

Tableau Certification Questions and Answers Sample for Exam Practice
Tableau Exam Questions and Answers for Desktop Specialist, Desktop Qualified Associate and Desktop Certified Professionals Data skills are in very high demand in every corporate. Organizations would like to assimilate simplified versions of the data

New ways of data analysis unveiled by Tableau
Tableau offers excellent range of tools to analyze data and render innovative insights. Read more about the exclusive features of Tableau.

Data Analytics and Visualization with Tableau
Big Data analytics and visualization are one of the most vital trends in Business Intelligence today. By leveraging advanced analytics, enterprises can study big data sets to gain in-depth insight into where the business stands currently, and identif

Advantages of Tableau 9 certification over conventional Business Intelligence courses
Tableau is successful software with innovative data visualization tools. If you’re looking for a solution that gives the end user the ability to generate powerful data visualization, Tableau may be a good fit. Tableau’s additional benefits include a
Latest blogs on technology to explore

Drug Safety & Pharmacovigilance: Your 2026 Career Passport to a Booming Healthcare Industry!
Why This Course Is the Hottest Ticket for Science Grads & Healthcare Pros (No Lab Coat Required!)" The Exploding Demand for Drug Safety Experts "Did you know? The global pharmacovigilance market is set to hit $12.5B by 2026 (Grand View Research, 202

Launch Your Tech Career: Why Mastering AWS Foundation is Your Golden Ticket in 2026
There’s one skill that can open all those doors — Amazon Web Services (AWS) Foundation

Data Science in 2026: The Hottest Skill of the Decade (And How Sulekha IT Services Helps You Master It!)
Data Science: The Career that’s everywhere—and Nowhere Near Slowing Down "From Netflix recommendations to self-driving cars, data science is the secret sauce behind the tech you use every day. And here’s the kicker: The U.S. alone will have 11.5 mill

Salesforce Admin in 2026: The Career Goldmine You Didn’t Know You Needed (And How to Break In!)
The Salesforce Boom: Why Admins Are in Crazy Demand "Did you know? Salesforce is the 1 CRM platform worldwide, used by 150,000+ companies—including giants like Amazon, Coca-Cola, and Spotify (Salesforce, 2025). And here’s the kicker: Every single one

Python Power: Why 2026 Belongs to Coders Who Think in Python
If the past decade was about learning to code, the next one is about coding smarter. And in 2026, the smartest move for any IT enthusiast is learning Python — the language that powers AI models, automates the web, and drives data decisions across ind

The Tableau Revolution of 2025
"In a world drowning in data, companies aren’t just looking for analysts—they’re hunting for storytellers who can turn numbers into decisions. Enter Tableau, the #1 data visualization tool used by 86% of Fortune 500 companies (Tableau, 2024). Whether

From Student to AI Pro: What Does Prompt Engineering Entail and How Do You Start?
Explore the growing field of prompt engineering, a vital skill for AI enthusiasts. Learn how to craft optimized prompts for tools like ChatGPT and Gemini, and discover the career opportunities and skills needed to succeed in this fast-evolving indust
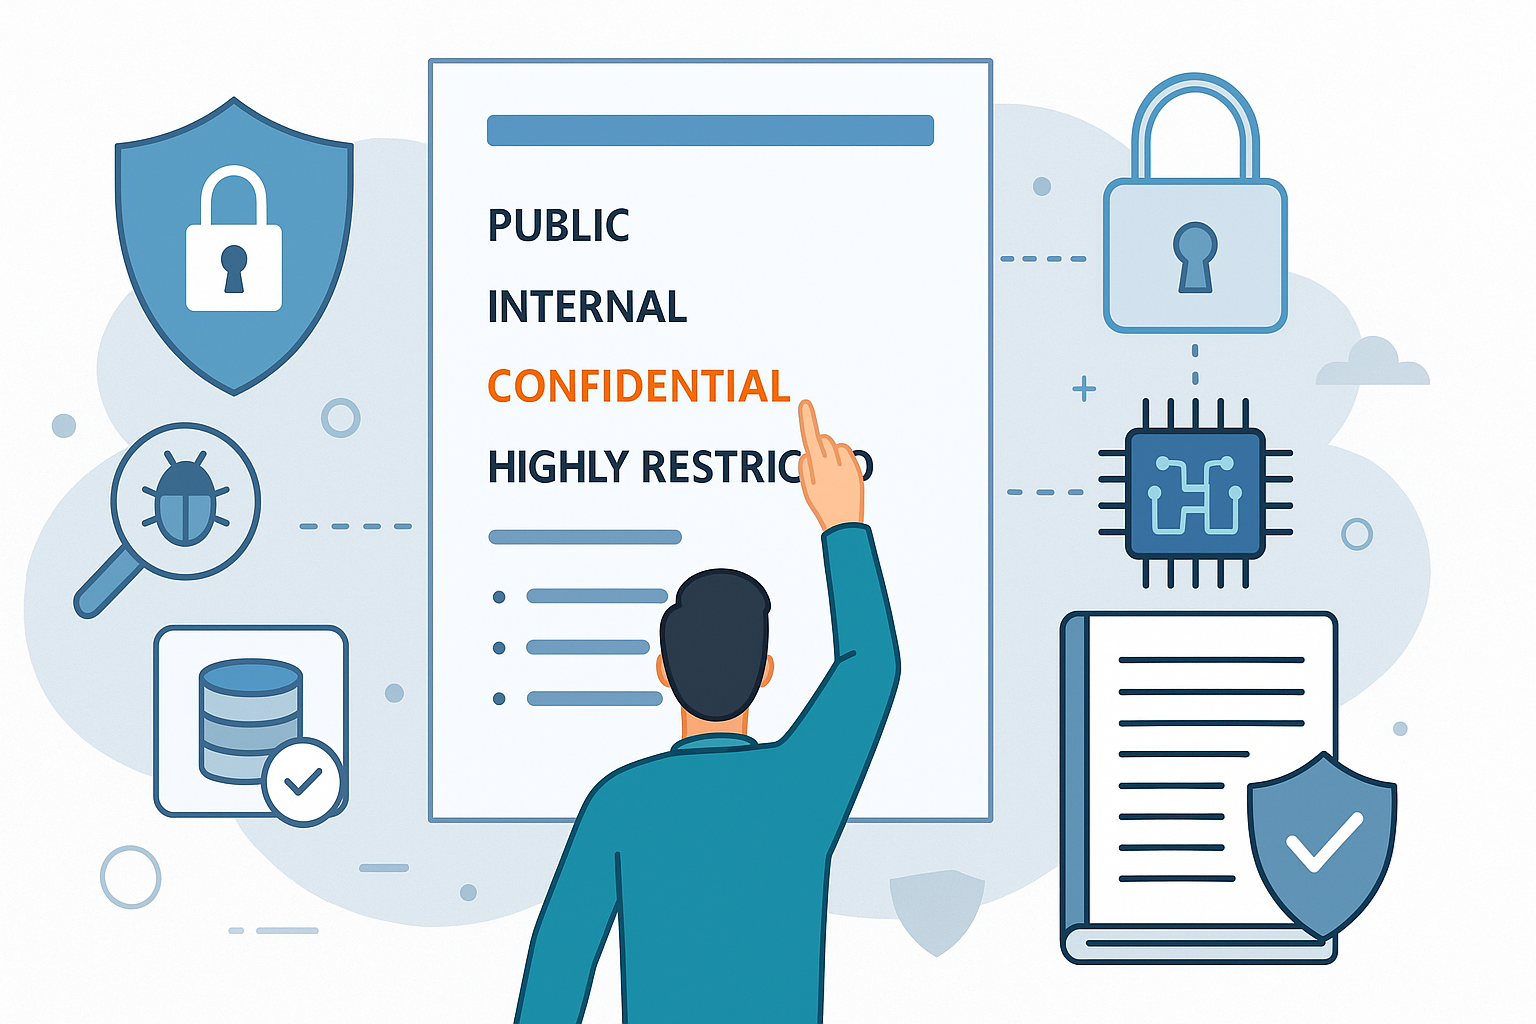
How Security Classification Guides Strengthen Data Protection in Modern Cybersecurity
A Security Classification Guide (SCG) defines data protection standards, ensuring sensitive information is handled securely across all levels. By outlining confidentiality, access controls, and declassification procedures, SCGs strengthen cybersecuri

Artificial Intelligence – A Growing Field of Study for Modern Learners
Artificial Intelligence is becoming a top study choice due to high job demand and future scope. This blog explains key subjects, career opportunities, and a simple AI study roadmap to help beginners start learning and build a strong career in the AI

Java in 2026: Why This ‘Old’ Language Is Still Your Golden Ticket to a Tech Career (And Where to Learn It!
Think Java is old news? Think again! 90% of Fortune 500 companies (yes, including Google, Amazon, and Netflix) run on Java (Oracle, 2025). From Android apps to banking systems, Java is the backbone of tech—and Sulekha IT Services is your fast track t