Top 60 Six Sigma Green Belt Test Questions and Answers for Practice
Six Sigma Green Belt Certification Questions and Answers:
The IASSC Lean Sigma Body of Knowledge has a comprehensive set of topics and adheres to the standards of Greenbelt certification. We have collated some certification questions to make your preparation easy for the 2025 six sigma green belt test. The questions are multiple choice patters and we have also highlighted the answer in bold. A brief description of the answer is also mentioned for easy understanding and remembrance, utilizing these you can evaluate yourself by taking six sigma green belt practice test. By reading through our certification questions, you will quickly recap all the topics learnt. These set of six sigma green belt exam questions and answers is a quick capsule to assimilate.
1. Which of the following is the key benefit of multi-vari charting?
- It keeps track of the time when measurements were made
- It graphically displays the variation in a process
- It assists in the breakdown of components of variation
- It is much easier to plot than most control charts
A multi-vari chart is a graphical representation of multiple variables on the same chart. Data variation can come from multiple sources.
-------------------------------------------------------------------------------------------------------------------------------
2. ----- statistics is used to apply to describe the data using numbers, charts, and graphs and the ----------statistics used determine the interrelationship of population parameters
A. Descriptive; inferential
Descriptive statistics deals with data presentation in numeric or graphic form or table form for data analysis. Inferential statistics: this is a technique of inferring about the population on the basis of observations obtained from the population.
-------------------------------------------------------------------------------------------------------------------------------
3. A ----- is used to explain the time scheduled by separate phases by breaking down the project processes and tasks for the dependencies to be accounted.
- Bar chart
- SPC chart
- PDCA
- Gantt chart
Gantt chart: Gantt chart is a type of bar chart which represent the start and finish dates of the project and shows many crucial elements like resources, milestones, tasks and dependencies.
--------------------------------------------------------------------------------------------------------------------------------
4. Which of these are not Multivariate analyses?
1. Factor analysis
2. MANOVA
3. ANOVA
4. Cluster analysis
Anova stands for analysis of variance. Anova is a business process improvement methodology. Anova analysis is the analysis of variation in mean (not median or mode) of different groups of the population or different populations. When root cause analysis methods like DMAIC, or DFSS cannot depict the errors then Anova analysis is recommended.
--------------------------------------------------------------------------------------------------------------------------------
5. Which of the following is a non-parametric test?
A. Regression
B. 2 tailed 2 sample t-test
C. ANOVA
D. Kruskal test
The Kruskal-Wallis H test (sometimes also called the "one-way ANOVA on ranks") is a rank-based nonparametric test to determine whether samples come from the same distribution. This is a one- way analysis of variance. This test is useful for comparison of two or more independent samples of equal or different sample sizes.
----------------------------------------------------------------------------------------------------------------------
6. Cause and Effect Diagram is not known as!
A. Ishikawa Diagram
B. 4-M
C. Affinity Diagram
D. None of the above
An affinity diagram collects data based on a few parameters like language, ideas, opinion, and issues and organizes them into groups based on these parameters. These groups get organized based on natural relationships.
----------------------------------------------------------------------------------------------------------------------------
7. What is the technique to trace the rule responsible for the problem and break the assumption for the process?
A. Assumption Busting
B. Analogy Technique
C. Benchmarking
D. Constrained Brain writing
Assumption bursting is a brainstorming and questioning technique that identifies conventional assumptions and eliminates all the challenges that become obstacles to get an optimal solution.
-----------------------------------------------------------------------------------------------------------------------------
8. Cost-benefit analysis does not include
A. Project benefits
B. Project cost factors
C. Project gain
D. Impact on competitor
A cost-benefit analysis analyzes business decisions. All the benefits of a situation or business actions are summed. The costs associated with them are subtracted. This is known as cost-benefit analysis. A CBA does not take into consideration the factors impacting the competitors.
-------------------------------------------------------------------------------------------------------------------------------
9. What is lean philosophy?
- Helps to provide a perfect value through a perfect value creation process that has zero waste
- Continuous Improvement
- Higher output by encouraging people to work hard and have targets
- Reducing cost and improving purchasing power. When samples are drawn out of a population randomly, what is said to be true?
Lean philosophy: Lean six sigma is a philosophy for performance improvement by removing waste and reducing variation. This philosophy removes eight kinds of defects. This method relies on collaborative team effort.
--------------------------------------------------------------------------------------------------------------------
10. When samples are drawn out of a population randomly, what is said to be true?
- The sample mean is always the same as the population mean
- The sample standard deviation will be the same as population standard deviation
- The sampling distribution approaches normality with an increase in sample size
- The sampling distribution would be triangular if the population is distributed as a triangular distribution
A random sampling is a sampling technique. Each sample has an equal opportunity of being chosen and the sample chosen is the unbiased representation of the entire population.
--------------------------------------------------------------------------------------------------------------------------------
11. Which of the following tools is most commonly used in the define phase of a project?
- Affinity diagram
- Control chart
- Failure mode and effects analysis
- Data collection checklist
Define is the first phase of the DMAIC phase of six sigma project. A control chart is the most effective tool used in the define phase.
--------------------------------------------------------------------------------------------------------------------
12. Which of these is considered a prioritization tool?
- Multi-voting
- Customer needs prioritization
- Focus Groups
- Nominal Group Technique
Multi-voting is a group decision making technique used for brain storming of ideas and prioritizing them. This technique reduces options to prevent information overload. Multi-voting is also known as N/3 voting. N refers to the total number of ideas.
--------------------------------------------------------------------------------------------------------------------------------
13. Which is true about critical path?
1. Zero slack
2. Event oriented
3. Shortest path
4. Time and cost not considered
A critical path analysis uses network analysis and is widely used in project management. A critical path analyses helps to schedule and manage complex projects a critical path has zero slack.
--------------------------------------------------------------------------------------------------------------------
14. The critical path of the project is best described as
(A) a series of steps with the highest costs(B) The tasks in the project which have the highest risk of failure(C) the sum of the tasks with the shortest time requirements (D) longest path from the start to the completion of the project
A critical path is a visual network planning tool. Critical path is the longest path from the time of beginning of the project till the end.
-----------------------------------------------------------------------------------------------------------------------------
15. Which of the following statistical tests should be used by the Green Belt for testing the means between two inter-related groups?
- 2 Sample t assuming equal variances
- 2 Sample t assuming unequal variances
- Paired t-test
- z test
A paired test is used to determine if the mean difference between the two sets of observations is zero. In a paired sample t-test, there is a twice measurement of each subject or entity. This results in a pair of observation.
-------------------------------------------------------------------------------------------------------------------------------
16. Standard Deviation in Six Sigma applications is referred to as the difference from the:
- Target
- Specification limits
- Nearest fit value
- Mean
A standard deviation in six sigma applications that lets you know how the data points are grouped around the mean for a specific given process, which in turn tells you how much variation exists.
----------------------------------------------------------------------------------------------------------------------------
17. In a typical DFSS Approach, which of these stages figures in most DFSS approaches?
- Innovate
- Identify
- Improve
- Control
In the design for six sigma (DFSS) approach in six sigma, is an improvement process in the six sigma to develop new processes or products. The DFSS approach can also be applied if the current process requires an incremental improvement.
--------------------------------------------------------------------------------------------------------------------------------
18. Which of these tools/techniques represent "continuous improvement"?
- Kaizen
- Six Sigma
- Lean
- Kanban
A kaizen or continuous improvement is a method of identifying opportunities and waste reduction. This practice is formalized by lean.
---------------------------------------------------------------------------------------------------------------------------
19. Japanese 5S methodology is created and used for:
- Continuous Improvement
- Prevent Defects
- Creating a productive work environment
- Reduce Variation
The Japanese 5s method supports lean in its basic form. The 5S stands for sort, straighten, shine, standardize, and sustain and is based on the Japanese concept for housekeeping (seiri, seiton, seiso, seiketsu, and shitsuke). This method helps organizations to maintain simplified and streamlined work environment.
----------------------------------------------------------------------------------------------------------------------------
20. What does OEE stand for?
- Overall Equipment Effectiveness
- Overall Estimation Effectiveness
- Overall Equipment Estimation
- Overall Effective Estimation
The overall equipment effectiveness is a measure of the manufacturing productivity. He manufacturing productivity is calculated by taking into the sub-components of manufacturing process like availability, performance and quality. OEE is the ratio of productive time to the planned production time.
OEE = (Good Count × Ideal Cycle Time)/ Planned production time
-----------------------------------------------------------------------------------------------------------------------
21. Which of the following techniques used in DOE helps you in identifying pure error?
- Replication
- Blocking
- Randomization
- Coding
A blocking technique helps to identify variables that are not important to the experimenter. Blocking technology reduces variability. Typically, blocking is an arrangement of experimental units in groups or blocks which are similar.
-------------------------------------------------------------------------------------------------------------------------------
22. A Six Sigma Green Belt practitioner constructs a control chart to display a process mean and its outer limits. In such a chart, what does UCL stand for?
- Upper Cycle Length
- Upper Control Limit
- Upper Cycle Limit
- Upper Control Length
Control charts are two-dimensional graph plotting visuals plotting performance on x-axis and time on the y-axis. Control chart has three attributes; Upper control limit (UCL), Lower control limit (LCL) and average or center line of the data. The upper control limit is a three process control above the standard deviation.
--------------------------------------------------------------------------------------------------------------------------------
23. One of the purposes of using a fishbone diagram is to:
- Separate a problem into smaller components
- Identify and classify sources of variations into major groups
- Define the problem in sequential order
- Show the relationship between parameters
A fish bone diagram is also called a cause-effect diagram. It is a visualization tool to display as many causes as possible for a problem. It sorts ideas into categories. This is a more structured method in cause and effect analysis.
----------------------------------------------------------------------------------------------------------------------
24. Which approach talks about equipment effectiveness?
- Lean
- TPM
- Six Sigma
- TOC
The total productive maintenance (TPM) is a new concept and a system of the machines, equipment, processes, and employees that add business value to an organization. This concept is used in equipment effectiveness.
--------------------------------------------------------------------------------------------------------------------------------
25. The best metric for measuring defectives is:
- DPMO
- DPU
- PPM
- DPO
The best metrics for measuring defectives in six sigma is parts per million defective (PPM). PPM is used to get the more accurate measure of defective rate. This method is more apt when the number of defective products produced is very small and percentage defective is not very effective.
------------------------------------------------------------------------------------------------------------------------------
26. If the Measure stage in a DMAIC approach is all about measuring the data for the existing process, what is the main objective in the Measure phase in a DFSS approach?
- Measure what you can measure
- Measure what the customer wants you to measure
- Set the key measurement steps and metrics
- Define operational metrics
The DFSS approach is used to design a product or service from scratch. This approach produces a very low defect level product or service. To produce such a product or service the customer expectations and needs should be measured.
---------------------------------------------------------------------------------------------------------------------
27. All the factors that might contribute to a production problem must be discovered. Which among the following problem-solving tools might be the best choice?
- Pareto diagrams
- Fishbone diagrams
- Histograms
- Control charts
A fish bone diagram identifies all the possible cause and effect to identify the root cause of a problem.
------------------------------------------------------------------------------------------------------------------------
28. Which of the following tools is used extensively in quality function deployment (QFD)?
(A) Affinity diagram
(B) Matrix diagram
(C) Cause and effect diagram
(D) Activity network diagram
Quality function deployment (QFD) is a research tool and a systematic method used to modify products to meet customer requirements. QFD is used to find the quality elements and engineering management measures that have the greatest influence on customer needs. Relationship matrix diagram gives complex relationships between quality elements and customer needs and is displayed with signs or weights.
-----------------------------------------------------------------------------------------------------------------------
29. Which of the following is the LEAST likely tool to assist the problem definition stage of Six Sigma?
- CTQ trees
- Pareto analysis
- Product yield data
- Control charts
The problem definition stage is the first stage in six sigma. DMAIC is a five-stage process of six sigma of problem-solving. “Define†is the first stage. Product yield data does not support the first stage in Six sigma.
--------------------------------------------------------------------------------------------------------------------
30. In a typical Measure Phase, which of the following activities should a Green Belt perform first?
- Stability
- Capability
- MSA
- Normality
The measured phase has more numeric and data analysis. The MSA( measurement system analysis) will quantify the amount of variation in the data induced by the measuring system. Conducting MSA can be very exhaustive.
-------------------------------------------------------------------------------------------------------------------------
31. In a typical MSA GAGE RR study conducted, what should the Six Sigma team determine about the Measurement System first?
- Accuracy
- Stability
- Resolution
- Linearity
The GAGE RR study is conducted in the measured phase of the six sigma project. It measures the accuracy of the project.
---------------------------------------------------------------------------------------------------------------------------
32. Which of the following scenarios is best suited to use an X-bar and R chart?
- A smaller sample size is needed
- It is necessary to know when to investigate a process for causes of variation
- The machine capability is wider than the specification
- An acceptable quality level must be established
The X-Bar chart is used to plot the process mean and process range. The R-chart is used to review the process variation which must be in control to interpret correctly the X-Bar chart.
-----------------------------------------------------------------------------------------------------------------------
33. When a cause-and-effect diagram is used to solve plant problems, what are the three parts a session is customarily divided into?
- Teamwork, cost-effectiveness, efficiency
- Brainstorming, prioritization and plan development
- Teamwork, planning and execution
- Cost-effectiveness, plan development, teamwork.
A cause and effect diagram helps to identify the possible causes and the outcomes of a problem. This is done is three parts; Brainstorming, prioritization and plan development
----------------------------------------------------------------------------------------------------------------------------
34. “Forming, Storming, Norming, and Performing†are terms that describe
(A) Process variation reduction and improvement phases
(B) Root Cause identification and corrective action
(C) Stages of team growth
(D) Steps of the brainstorming process
Teams can perform better collectively than as individuals to achieve common goals. “Forming, Storming, Norming, and Performing†are terms that describe team growth and the various stages involved.
--------------------------------------------------------------------------------------------------------------------------
35. Which item should not be identified in the Define Phase?
- Root Causes
- The key problem area
- Possible financial loss
- Intangibles
The define phase in DMAIC consists of identifying the business opportunity, key problem areas, selecting the key resources, and initiating the project charter. This phase is to define all the possible elements of a project.
--------------------------------------------------------------------------------------------------------------------------------
36. The distribution that follows principles of an exponential distribution is:
- Poisson
- Binomial
- Chi-Square
- Normal
A Poison distribution is a discrete probability distribution of the number of events in a fixed period of time, and the exponential distribution deals with the time between occurrences of successive events as time flows by continuously. A Poisson distribution can be derived from the exponential distribution.
------------------------------------------------------------------------------------------------------------------------------
37. For small incremental changes which Japanese technique is useful?
- Kaizen
- Poka-Yoke
- Kata
- Mura
Kaizen technology in Six Sigma is useful for the systematic achievement of small incremental changes in processes to achieve efficiency and quality. Kaizen is also known as continuous improvement
--------------------------------------------------------------------------------------------------------------------------------
38. Poka-yoke is best defined as:
- Capturing the voice of the customer
- Improving machine efficiency
- Reducing field failures to virtually zero
- Preventing controllable defects
Poka–Yoke is an approach for mistake-proofing to eliminate or prevent errors. This approach makes use of simple tools to prevent errors.
--------------------------------------------------------------------------------------------------------------------------------
39. Which of the following is NOT necessary for the Six Sigma team to update in the Project Charter in the Define Phase?
- Project Name and Description
- Business need
- Project purpose
- Constraints
DMAIC – Define, measure, analyze, improve and control is a six sigma methodology. A project charter is the first step in define process. A project charter can create or destroy a successful project.
------------------------------------------------------------------------------------------------------------------
40. Which of the following distributions describes the ratios of two variances drawn from the same normal population?
- F statistic
- Student"s t-test
- Chi-square
- Normal
F-test is a statistical test that compares the variances of two samples taken from the populations with different variances to test the hypothesis. The objective of F-test is to check the differences in the sample variance.
-------------------------------------------------------------------------------------------------------------------------------
41. One of the purposes of using a fishbone diagram is to:
- Separate a problem into smaller components
- Identify and classify sources of variations into major groups
- Define the problem in sequential order
- Show the relationship between parameters
A fish bone diagram is also called a cause-effect diagram. It is a visualization tool to display as many causes as possible for a problem. It sorts ideas into categories. This is a more structured method in cause and effect analysis.
----------------------------------------------------------------------------------------------------------------------
42. Which of the following tools helps in visualizing series of causes to an effect?
- Cause and Effect Matrix
- Correlation Diagram
- Ishikawa Diagram
- Value Stream Mapping
The Ishikawa diagram also known asfish bonediagram helps to visualize many potential caused for the specific problem.
----------------------------------------------------------------------------------------------------------------------
43. Which of the following is an example of a Primary metric for Six Sigma projects?
- Quality
- Morale of employees
- Average turnover/cycle time
- Customer Satisfaction
44. Which matrix diagram illustrates the relationship between three planes?
- Y-type
- X-type
- P-type
- Control charts
A matrix diagram depicts the relationship between two or more groups. A basic Y shaped diagram showed the relationship between three groups in a circular motion.
--------------------------------------------------------------------------------------------------------------------------------
45. Which of the following measures of central tendency is preferred when the data does not have outliers?
- Mean
- Mode
- Median
- None of the above
Most populations exhibit normality, mean is the most suitable central tendency used to describe normal data.
------------------------------------------------------------------------------------------------------------------------------
46. Poka Yoke is a lean manufacturing concept that is used for what purpose?
- Process levelling
- Mistake proofing
- Process visualization
- Quick set up
Poka-Yoke is a Japanese word which means mistake proofing. This method is used in six sigma for eliminating errors.
--------------------------------------------------------------------------------------------------------------------------------
47. For a process working at 5 Sigma level, how many opportunities are considered to lie outside of the specification limits provided by the customer?
- 233
- 6210
- 3.4
- 66807
Sigma 4 level indicates the maximum level of defects per million in a process or a system and relates to the overall percentage of accuracy. A 5 sigma level 233 errors per million
----------------------------------------------------------------------------------------------------------------------------
48. The most important factor for the success of six sigma projects is:
- Leadership support
- Team support
- Teamwork
- Inter-department harmony
A six sigma process is aimed at reduction of variation, defects and risks. To implement six sigma leadership support is very important.
---------------------------------------------------------------------------------------------------------------------------
49. In a 4 sigma level process, how many opportunities lie outside the specification limits provided by the customer?
- 6210
- 233
- 456
- 876
Sigma 4 level indicates the maximum level of defects per million in a process or a system and relates to the overall percentage of accuracy. A 4 sigma level 6210 errors per million.
------------------------------------------------------------------------------------------------------------------------------
50. Which analysis helps to prioritize customer requirements?
- Kaizen
- Kano
- Control charts
- Poisson
Kano analysis helps to prioritize customer requirements, once they are identified. Kano analysis is used in define phase of DMAIC process in six sigma.
----------------------------------------------------------------------------------------------------------------------
51. Which of the following errors is typically associated with the notion, "False positive"?
- Type I error
- Type II error
- Type III error
- Depends on the experiments
A Type I error occurs when a null hypothesis is rejected even if it is true. The error accepts the alternative hypothesis, despite it being attributed to chance. Also referred to as a "false positive".
-----------------------------------------------------------------------------------------------------------------------------
52. Which of these are categorized under Precision in a GAGE RR Study?
- Repeatability and Reproducibility
- MSA
- Cpk
- Ppk
A GAGE RR study or repeatability and Reproducibility is useful for evaluating the capability of a measurement system.
----------------------------------------------------------------------------------------------------------------------
53. What is overproduction type of waste?
- Producing excess quantity than needed
- Producing lower quality and more quantity
- Producing lower quantity with higher quality
- Producing lower quantity than needed
Overproduction type of waste means producing more quantity than required.
--------------------------------------------------------------------------------------------------------------------------------
54. Which of the following variations are identified in control charts?
- Random and chance
- Special and assignable
- Normal and Special
- Normal and random
Control charts identify two types of variations; Normal and special variations.
----------------------------------------------------------------------------------------------------------------------
55. When is FMEA process generally performed?
- Begins during the conceptualization stages of design and continues throughout the project.
- Just after the production tool is authorized
- Ends as soon as conceptualization is done
- Performed during the design stage
Failure mode and Effect analysis (FMEA) is a systematic method/approach o identify the possible failure in design, a manufacturing or assembly process, or a product or service. This process begins during the conceptualization of the project and continues throughout the project lifecycle.
----------------------------------------------------------------------------------------------------------------------
56. All the below are the examples of one-way analysis Variance except:
- Anova
- F-test
- t-test
- Tukey multiple comparisons
A Tukey multiple comparison tests and single test multiple comparison processes.
--------------------------------------------------------------------------------------------------------------------------------
57. An F-distribution resembles more closely
- A chi-square distribution
- A binomial distribution
- A Normal distributions
- An exponential distribution
A chi-square test is also known as the goodness of fit test. This test compares and checks if the sample matches the population.
----------------------------------------------------------------------------------------------------------------------
58. In project development cycle, what would a “Waste†mean?
- Time spent on unproductive events
- Time spent on fixing defects
- Time spent on Unproductive resources
- Time spent on unnecessary expenditure
Anything that does not contribute to the functionality of the final product is considered as a “Waste†in lean. Which means that the time spent on fixing defects is considered as waste.
----------------------------------------------------------------------------------------------------------------------
59. Which of the following errors is typically associated with the notion, "False negative"?
- Type I error
- Type II error
- Type III error
- Depends on the experiments
A Type II error occurs when a null hypothesis is retained even if it is false.
--------------------------------------------------------------------------------------------------------------------------------
60. What is COPQ?
- Cost of production quantity
- Cost of poor quality
- Cost of production quality
- Cost of Poor quantity
The cost of poor quality or poor quality costs occur when the product is not manufactured up to the mark. The COPQ would vanish if all they systems and products manufactured are perfect.
--------------------------------------------------------------------------------------------------------------------------------
Exam Details: https://www.iassc.org/six-sigma-certification/green-belt-certification/
Exam name: IASSC Certified Green Belt Exam
Duration: 180 minutes
No. of questions: 100
Passing score: 77%
Validated against: https://www.iassc.org/body-of-knowledge/green-belt-body-of-knowledge/
Format: Multiple choice/True-False
Exam price: $295 USD
--------------------------------------------------------------------------------------------------------------------------------
Find a course provider to learn Six Sigma
Java training | J2EE training | J2EE Jboss training | Apache JMeter trainingTake the next step towards your professional goals in Six Sigma
Don't hesitate to talk with our course advisor right now
Receive a call
Contact NowMake a call
+1-732-338-7323Enroll for the next batch
Six Sigma Online Training Classes
- Dec 10 2025
- Online
Six Sigma Online Training Classes
- Dec 11 2025
- Online
Six Sigma Online Training Classes
- Dec 12 2025
- Online
Related blogs on Six Sigma to learn more

Six Sigma White Belt Certification Exam Questions and Answers
The six sigma white belt certification will give you knowledge on process improvement, why it is used in businesses globally to eliminate waste. You will take the first step into the world of six sigma and be a part of the process improvement team

Top 50 Six Sigma Black Belt Certification Exam Questions and Answers
The IASSC Lean Six Sigma Black Belt™ (ICBB™) certification will give you proficiency in lean six sigma methods of DMAIC. We have a collection of Six Sigma Black Belt Certification question and answers for you to quickly take a recap of your learning
Latest blogs on technology to explore

From Student to AI Pro: What Does Prompt Engineering Entail and How Do You Start?
Explore the growing field of prompt engineering, a vital skill for AI enthusiasts. Learn how to craft optimized prompts for tools like ChatGPT and Gemini, and discover the career opportunities and skills needed to succeed in this fast-evolving indust
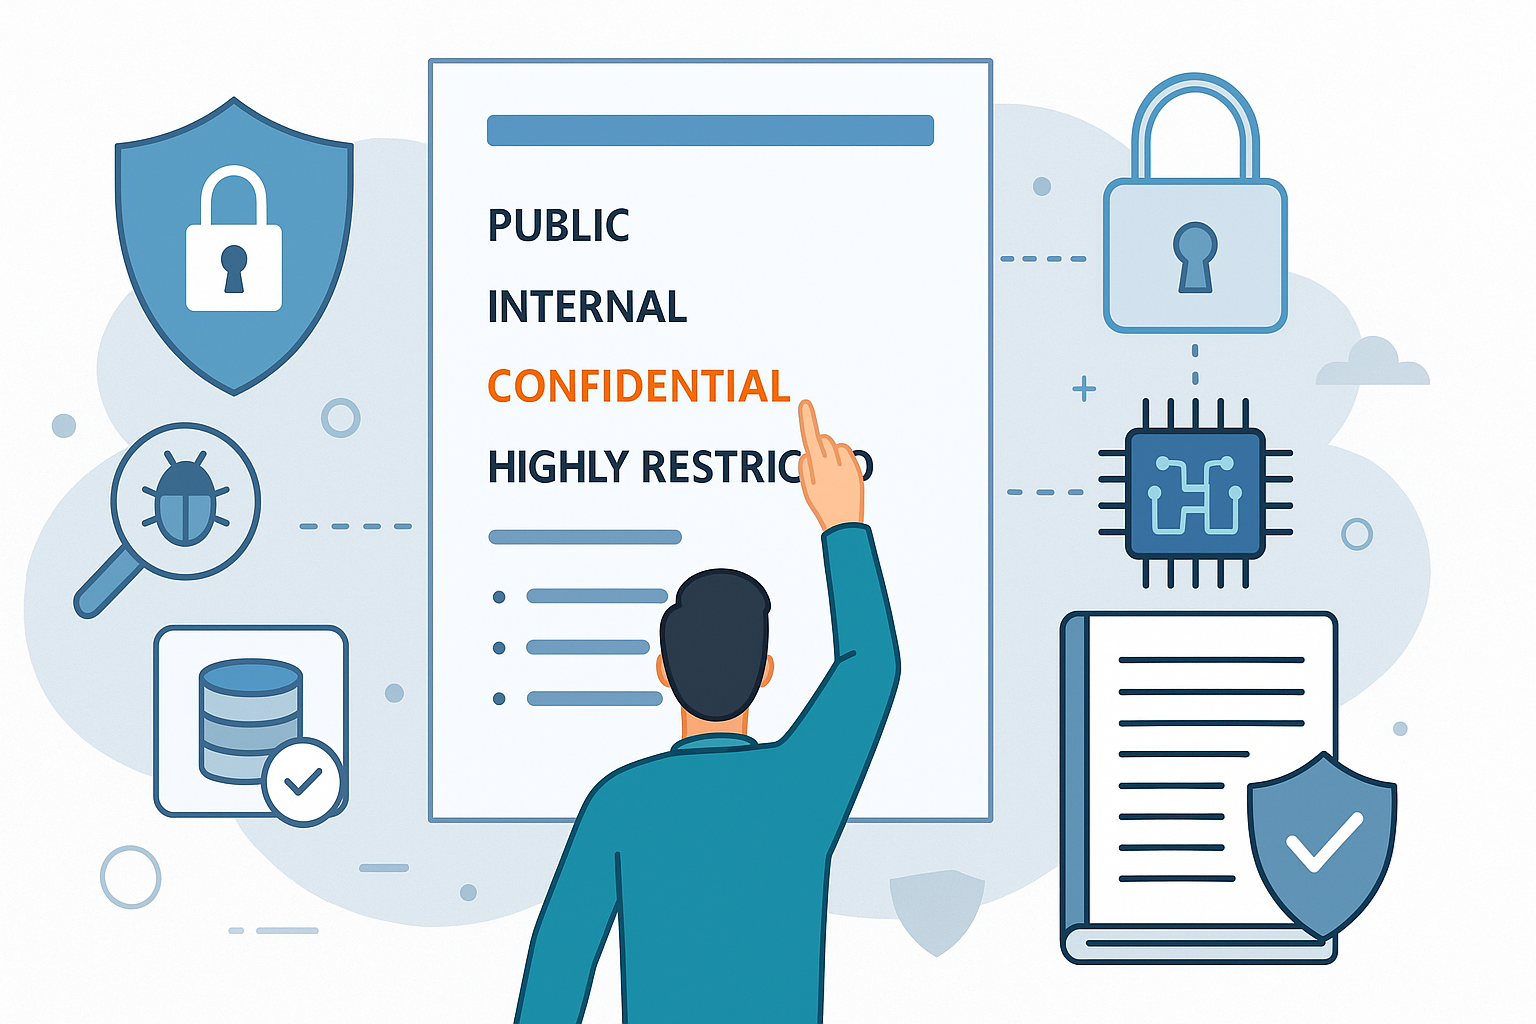
How Security Classification Guides Strengthen Data Protection in Modern Cybersecurity
A Security Classification Guide (SCG) defines data protection standards, ensuring sensitive information is handled securely across all levels. By outlining confidentiality, access controls, and declassification procedures, SCGs strengthen cybersecuri

Artificial Intelligence – A Growing Field of Study for Modern Learners
Artificial Intelligence is becoming a top study choice due to high job demand and future scope. This blog explains key subjects, career opportunities, and a simple AI study roadmap to help beginners start learning and build a strong career in the AI

Java in 2026: Why This ‘Old’ Language Is Still Your Golden Ticket to a Tech Career (And Where to Learn It!
Think Java is old news? Think again! 90% of Fortune 500 companies (yes, including Google, Amazon, and Netflix) run on Java (Oracle, 2025). From Android apps to banking systems, Java is the backbone of tech—and Sulekha IT Services is your fast track t

From Student to AI Pro: What Does Prompt Engineering Entail and How Do You Start?
Learn what prompt engineering is, why it matters, and how students and professionals can start mastering AI tools like ChatGPT, Gemini, and Copilot.

Cyber Security in 2025: The Golden Ticket to a Future-Proof Career
Cyber security jobs are growing 35% faster than any other tech field (U.S. Bureau of Labor Statistics, 2024)—and the average salary is $100,000+ per year! In a world where data breaches cost businesses $4.45 million on average (IBM, 2024), cyber secu

SAP SD in 2025: Your Ticket to a High-Flying IT Career
In the fast-paced world of IT and enterprise software, SAP SD (Sales and Distribution) is the secret sauce that keeps businesses running smoothly. Whether it’s managing customer orders, pricing, shipping, or billing, SAP SD is the backbone of sales o

SAP FICO in 2025: Salary, Jobs & How to Get Certified
AP FICO professionals earn $90,000–$130,000/year in the USA and Canada—and demand is skyrocketing! If you’re eyeing a future-proof IT career, SAP FICO (Financial Accounting & Controlling) is your golden ticket. But where do you start? Sulekha IT Serv

Train Like an AI Engineer: The Smartest Career Move You’ll Make This Year!
Why AI Engineering Is the Hottest Skillset Right Now From self-driving cars to chatbots that sound eerily human, Artificial Intelligence is no longer science fiction — it’s the backbone of modern tech. And guess what? Companies across the USA and Can
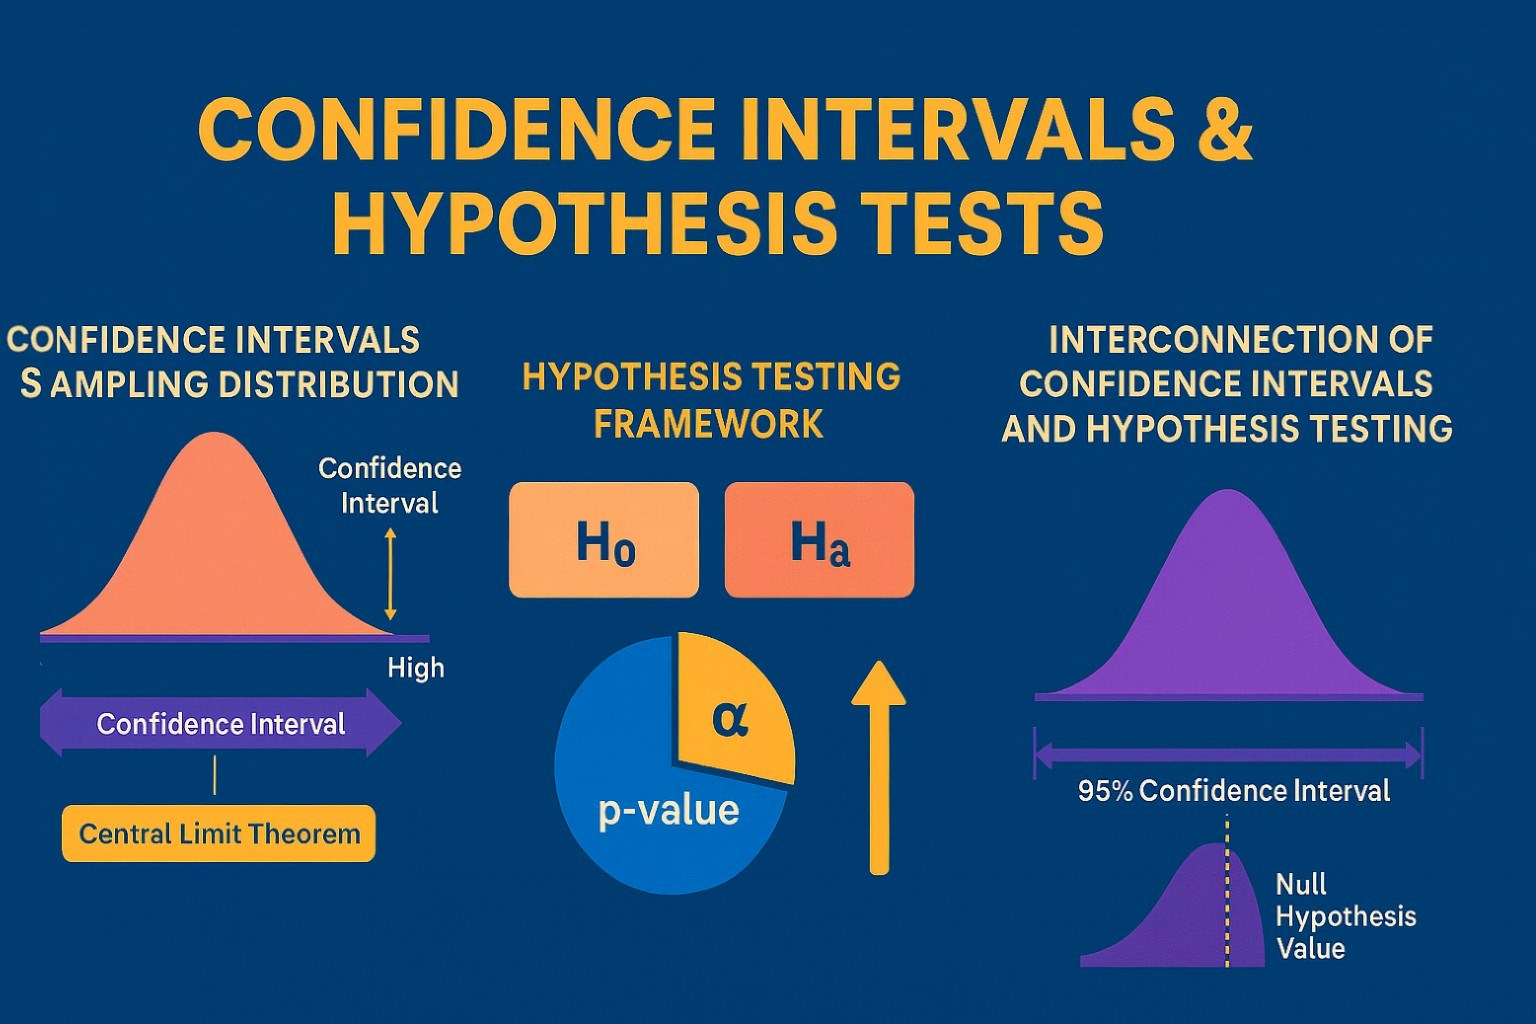
Confidence Intervals & Hypothesis Tests: The Data Science Path to Generalization
Learn how confidence intervals and hypothesis tests turn sample data into reliable population insights in data science. Understand CLT, p-values, and significance to generalize results, quantify uncertainty, and make evidence-based decisions.