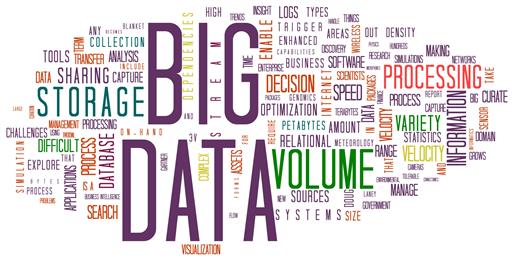
Data visualization and its growing significance in business decision making
As Carly Fiorina, tech stalwart cites,
“The goal is to turn data into information, and information into insight.”
Digging for business insights that are far outreaching than just the key metrics is indeed more muscle added to business analysis. Data visualization helps businesses to look at information differently, with more imagination which gives insights that will actually promote business decision making to the next level.
In this write up, I am going to dissect how exactly Data visualization is going to help businesses chop down large chunks of data into meaningful nuggets that deliver value.
The four major benefits of data visualization can be presented as below:
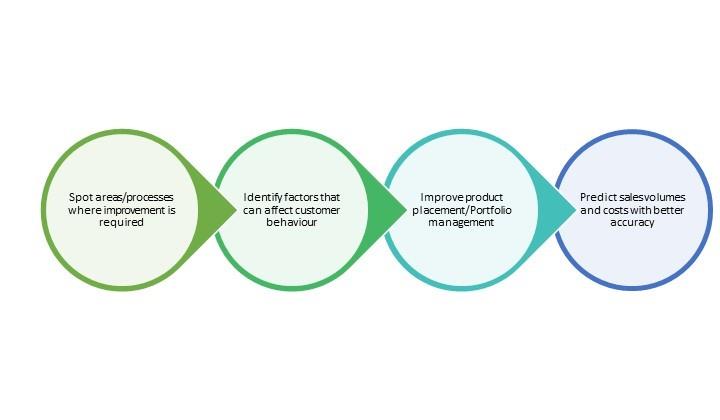
The above benefits of data visualization are applicable for businesses of all sizes and shapes. Even smaller businesses that are gearing up to launch themselves amidst leagues of big corporations can use data visualization to predict their sales volumes and market capitalization with ease.
Spot areas/processes where improvement is required
Business processes can get redundant with time. The changing market scenario demands every business to adapt themselves to remain agile and competitive. For this detailed understanding of the current customer behaviour, the product positioning of the business, market volume and similar statistics are required. Analysing them and comprehending information quickly for decision making requires data visualization. Mere statistics mean and median figures are no longer sufficient.
Identify factors that can affect customer behaviour
Extensive information and statistics about sales volumes, customer preferences/behaviour will begin to make sense when they are seen from a different angle. Especially with data visualization a better understanding of customer behaviour can be gained. It will lead to better product designs as pictorial understanding of which product sold the most, during which season and what price point, etc. can be known. Correlation and relationships between product choices and customer wants will become more evident helping businesses to fine tune their products.
Improve product placement/Portfolio management
Data visualization is being continuously deployed to pin-point emerging trends in products with better features. The return on investment on various products can be interpreted from a market point of view in a better light to decide whether to introduce new product lines to discontinue present ones. Investment banks and stock broking houses are using data visualization to zero in on investments that will increase in net worth in the future. Portfolio management using data visualization is a topic of its own Big Data Certification courses.
Simplifies business reports communication
Even now, most businesses are relying on pages long black and white table and columns with irrelevant data for decision making. It is no surprise that most businesses are suffering from a lag in quick decision as interpreting trends and key insights from conventional reporting formats are difficult. Data visualization depicted with graphs and diagrams makes it easier for businesses to better communicate the results amidst their own departments. There is also an increasing trend of businesses investing in Big Data training and certification programs for their key employees to take leverage of data visualization.
Benefits explained, is it easy to implement data visualization? It is easy, however, a business needs to prepare well in advance since adapting to a new technology requires investment in personnel training and development.
Here is what needs to be done before integrating data visualization into business decision making:
- Make users (employees, team lead and managers) understand the nature of data that will be used for data visualization
- Use what form of data visualization is going to be used
- Communicate the use of charts, graphs and diagrams across the organization for consistency
- Train employees how to prepare minimalist charts and diagrams that deliver information aptly
- Decide whether to use auto chart preparing software or tools or go for ingenious data visualization programs.
The Bottom Line
Data visualization is a magnificent business tool for any business that wants to maximize its business volumes without overshooting expenses. It simplifies strategy formulation, product placement and improves interpersonal communication of business reports within the organization. The only challenge that businesses will have to overcome is the training of personnel who will be using it routinely. Establishing consistency is the key to attaining success through data visualization.
Find a course provider to learn Big Data
Java training | J2EE training | J2EE Jboss training | Apache JMeter trainingTake the next step towards your professional goals in Big Data
Don't hesitate to talk with our course advisor right now
Receive a call
Contact NowMake a call
+1-732-338-7323Take our FREE Skill Assessment Test to discover your strengths and earn a certificate upon completion.
Enroll for the next batch
big data full course
- Aug 4 2025
- Online
big data full course
- Aug 5 2025
- Online
big data full course
- Aug 6 2025
- Online
big data full course
- Aug 7 2025
- Online
big data full course
- Aug 8 2025
- Online
Related blogs on Big Data to learn more
What is Big Data – Characteristics, Types, Benefits & Examples
Explore the intricacies of "What is Big Data – Characteristics, Types, Benefits & Examples" as we dissect its defining features, various types, and the tangible advantages it brings through real-world illustrations.
Top 10 Open-Source Big Data Tools in 2024
In the dynamic world of big data, open-source tools are pivotal in empowering organizations to harness the immense potential of vast and complex datasets. Moreover, as we enter 2024, the landscape big data tools and technologies continues evolving be
AWS Big Data Certification Dumps Questions to Practice Exam Preparation
Certification in Amazon Web Service Certified Big data specialist will endorse your skills in the design and implementation of the AWS services on the data set. These aws big data exam questions are prepared as study guide to test your knowledge and
Top 25 Big Data Questions and Answers for Certification Passing score
You can appear for big data certification exam with confidence and come out with certification. We have prepared a bunch of important big data exam questions along with the correct answer and the explanation for the right answer. Utilize these sample
Sixth Edition of Big Data Day LA 2018 - Register Now!
If you’re keen tapping into the advances in the data world, and currently on a quest in search engines, looking for Big Data conferences and events in the USA, there is a big one coming up your way! Yes, the sixth annual edition of Big Data Day LA
15 Popular Big Data Courses to learn for the future career
We have found a list of big data courses that are necessarily required for the future. Professionals and freshmen who are learning these courses prepare the participants to see bigdata careers with high pay jobs.

Best countries to work for Big Data enthusiasts
China is fast becoming a global leader in the world of Big Data, and the recently held China International Big Data Industry Expo 2018
Top Institutes to enroll for Big Data Certification Courses in NYC
If achieving a career breakthrough is hard, harder is sustaining a long-run. Why? Organizations are focusing on New Yorkers who can work dynamically and leverage their skills from the word go, and that’s why.

The emergence of Cloudera
Cloudera is the leading worldwide platform provider of Machine Learning. There is reportedly an accelerated momentum in the Cybersecurity market.
Latest blogs on technology to explore

Understanding Artificial Intelligence: Hype, Reality, and the Road Ahead
Explore the reality of Artificial Intelligence (AI) — its impact, how it works, and its potential risks. Understand AI's benefits, challenges, and how to navigate its role in shaping industries and everyday life with expert training programs
How Much Do Healthcare Administrators Make?
Discover how much healthcare administrators make, the importance of healthcare, career opportunities, and potential job roles. Learn about salary ranges, career growth, and training programs with Sulekha to kickstart your healthcare administration jo

How to Gain the High-Income Skills Employers Are Looking For?
Discover top high-income skills like software development, data analysis, AI, and project management that employers seek. Learn key skills and growth opportunities to boost your career.

What Companies Expect from Product Managers in 2025: Skills, Tools, and Trends
Explore what companies expect from Product Managers in 2025, including essential skills, tools, certifications, and salary trends. Learn how to stay ahead in a rapidly evolving, tech-driven product management landscape.

Breaking Into AI Engineering: Skills, Salaries, and Demand in the US
Discover how to break into AI engineering with insights on essential skills, salary expectations, and rising demand in the US. Learn about career paths, certifications, and how to succeed in one of tech’s fastest-growing fields.

Cybersecurity Training: Powering Digital Defense
Explore top cybersecurity training programs in the USA to meet rising demand in digital defense. Learn about certifications, salaries, and career opportunities in this high-growth field.

Why Pursue Data Science Training?
Empower your career in a data-driven world. Learn why data science training is crucial for high-demand jobs, informed decisions, and staying ahead with essential skills.

What Does a Cybersecurity Analyst Do? 2025
Discover the vital role of a Cybersecurity Analyst in 2025, protecting organizations from evolving cyber threats through monitoring, threat assessment, and incident response. Learn about career paths, key skills, certifications, and why now is the be

Artificial intelligence in healthcare: Medical and Diagnosis field
Artificial intelligence in healthcare: Medical and Diagnosis field

iOS 18.5 Is Here: 7 Reasons You Should Update Right Now
In this blog, we shall discuss Apple releases iOS 18.5 with new features and bug fixes