Using Python for Data Science
Pythonis a powerful, easy to learn programming language that has high-levels of data structures, and a simple yet efficient approach to object-oriented programming. It features dynamic typing, elegant syntax, and effective interpretation capabilities, which make it a preferred language for application development on most platforms.
It is only recently that it made inroads into the field of Data Science as previously, it was rather complex to do critical statistics in this programming language. However, today there is a wide range of tools available in this scripting language to address almost all the elements of scientific computing. Facebook has now turned to Python’s library Pandas for data analytics because it provides the benefit of using a single programming language across different applications.
On the other hand, Bank of America also uses Pythonto analyze and interpret its financial data. It is also being used by the Theoretical Physics Division of Los Alamos National Laboratory to control simulations, as well as analyze and visualize data in the most efficient manner. And this is just a glimpse of how more and more organizations are using this platform for data analysis, visualization, and scientific computing.
Popular Python Libraries for Data Science
While this popular programming language provides a number of libraries to perform data analysis and computing, here are the best ones to get started:
- NumPy: It is the fundamental for effective scientific computing with Python programming language. It supports multi-dimensional and large matrices and arrays, and also includes an array of high-level mathematical functions that can operate on these matrices or arrays.
- Matplotlib: It is typically a 2D plotting library that has the ability to generate data visualizations in the form of power spectra, histograms, scatterplots, bar charts, etc. and requires only a few lines of coding.
- Pandas: It is built on top of NumPy library, and provides data operations and structures to manipulate time series and numerical tables.
- SciPy: It also works with NumPy arrays, and offers routines for effective numerical optimization and integration.
- Scikit-Learn: This machine-learning library is built on NumPy, Matplotlib and SciPy, and implements classification, clustering, and regression of algorithms, including logistic regression, support vector machines, random forests, gradient boosting, and naïve Bayes.
R or Python?
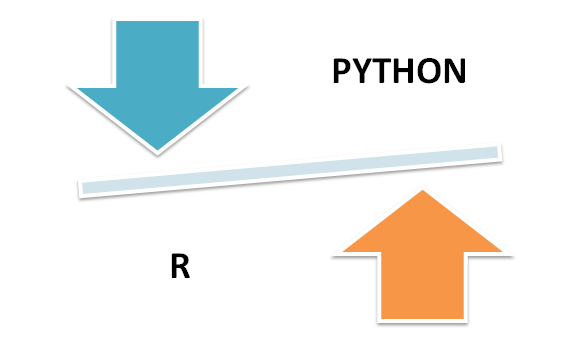
Python’s growing use in a wide spectrum of data science applications has put it in stiff competition with R, another software environment and programming language that is designed to perform the type of data analysis and visualization Python is now able to handle. With this, speculations arise whether one of these languages will eventually outshine the other in the field of data science. Therefore, it is crucial to decide which language to learn or what to use in a specific project.
Usability: In the field of data analysis, Python is typically used when the analysis tasks have to be integrated with web applications or the statistics code is to be integrated into production database. On the other hand, R is used when the tasks demand analysis on individual servers or standalone computing.
Tasks: As a comprehensive programming language, the former is good to implement algorithms for use in production. However, R is easier to use for exploratory tasks. With this language, critical statistical models can be easily written with just a few lines of code.
Data Handling Capabilities: Python’s NumPy and Pandas libraries are ideal for data analytics. On the other hand, R is preferred for data analysis because it has a large number of packages, the benefit of using formulas, and easily usable tests. It can be used for basic data analysis without the need to install the packages. However, for big data sets, you can use R packages such as dplyr and data.table.
Find a course provider to learn Python
Java training | J2EE training | J2EE Jboss training | Apache JMeter trainingTake the next step towards your professional goals in Python
Don't hesitate to talk with our course advisor right now
Receive a call
Contact NowMake a call
+1-732-338-7323Take our FREE Skill Assessment Test to discover your strengths and earn a certificate upon completion.
Enroll for the next batch
Python Programming Hands-on Training with Job Placement
- Jun 29 2026
- Online
Python Programming Hands-on Training with Job Placement
- Jun 30 2026
- Online
Python Programming Hands-on Training with Job Placement
- Jul 1 2026
- Online
Python Programming Hands-on Training with Job Placement
- Jul 2 2026
- Online
Python Programming Hands-on Training with Job Placement
- Jul 3 2026
- Online
Related blogs on Python to learn more
PYTHON PROGRAMMING
Discover Python, a versatile programming language ideal for web development, data analysis, and machine learning. Learn its easy syntax and extensive libraries to unlock a world of career opportunities in tech.
Python: The Language of Innovation and Versatility
"Master Python with Sulekha Tech Courses and boost your tech career. Find expert-led training in the USA and Canada for roles like Data Scientist and Machine Learning Engineer, and start your journey to innovation today."
Python vs. C++: Which to Learn and Where to Start
Compare Python and C++ programming languages, learn which language is best for your needs and where to start your programming journey, with tips on getting started and resources for further learning.
Top 8 DevOps Programming Languages That You Must Know
Top 8 DevOps programming languages that every DevOps engineer should know. From Python to PHP, learn the essential skills for automating and streamlining software delivery."
How did I successfully complete Python course?
Embark on a journey of student’s success story in Python programming, uncovering stories of resilience, growth, and achievement. Be inspired by their transformative experiences, unwavering dedication, and remarkable successes in mastering Python and
What are the top 10 Python Applications in the Real World?
Discover the top 10 Python applications transforming the real world across web development, audio and video Applications, business applications data science, game development, and more.
Ruby vs. Python: Pros, Cons, and Where to Start
Ruby vs. Python: Pros, Cons, and Where to Start Learning a programming language is helpful as it opens up numerous career prospects in the ever-growing technology field. Whether it is software development, web development, data science, or artificia
Data Types in Python for Data Science Applications
Python is a multipurpose programming language that finds applications across various domains. Its simplicity and flexibility make it a popular choice for web development, where frameworks like Django and Flask enable the creation of dynamic websites.
How to Build a Data Web Scraper Tool with Python
Web scraping involves processes to extract data from websites. This process is often performed using software that can simulate a user's actions on a website.
10 Python Tips and Tricks for Efficient Coding
Introduction
Latest blogs on technology to explore

Drug Safety & Pharmacovigilance: Your 2026 Career Passport to a Booming Healthcare Industry!
Why This Course Is the Hottest Ticket for Science Grads & Healthcare Pros (No Lab Coat Required!)" The Exploding Demand for Drug Safety Experts "Did you know? The global pharmacovigilance market is set to hit $12.5B by 2026 (Grand View Research, 202

Launch Your Tech Career: Why Mastering AWS Foundation is Your Golden Ticket in 2026
There’s one skill that can open all those doors — Amazon Web Services (AWS) Foundation

Data Science in 2026: The Hottest Skill of the Decade (And How Sulekha IT Services Helps You Master It!)
Data Science: The Career that’s everywhere—and Nowhere Near Slowing Down "From Netflix recommendations to self-driving cars, data science is the secret sauce behind the tech you use every day. And here’s the kicker: The U.S. alone will have 11.5 mill

Salesforce Admin in 2026: The Career Goldmine You Didn’t Know You Needed (And How to Break In!)
The Salesforce Boom: Why Admins Are in Crazy Demand "Did you know? Salesforce is the 1 CRM platform worldwide, used by 150,000+ companies—including giants like Amazon, Coca-Cola, and Spotify (Salesforce, 2025). And here’s the kicker: Every single one
Python Power: Why 2026 Belongs to Coders Who Think in Python
If the past decade was about learning to code, the next one is about coding smarter. And in 2026, the smartest move for any IT enthusiast is learning Python — the language that powers AI models, automates the web, and drives data decisions across ind

The Tableau Revolution of 2025
"In a world drowning in data, companies aren’t just looking for analysts—they’re hunting for storytellers who can turn numbers into decisions. Enter Tableau, the #1 data visualization tool used by 86% of Fortune 500 companies (Tableau, 2024). Whether

From Student to AI Pro: What Does Prompt Engineering Entail and How Do You Start?
Explore the growing field of prompt engineering, a vital skill for AI enthusiasts. Learn how to craft optimized prompts for tools like ChatGPT and Gemini, and discover the career opportunities and skills needed to succeed in this fast-evolving indust

How Security Classification Guides Strengthen Data Protection in Modern Cybersecurity
A Security Classification Guide (SCG) defines data protection standards, ensuring sensitive information is handled securely across all levels. By outlining confidentiality, access controls, and declassification procedures, SCGs strengthen cybersecuri

Artificial Intelligence – A Growing Field of Study for Modern Learners
Artificial Intelligence is becoming a top study choice due to high job demand and future scope. This blog explains key subjects, career opportunities, and a simple AI study roadmap to help beginners start learning and build a strong career in the AI
Java in 2026: Why This ‘Old’ Language Is Still Your Golden Ticket to a Tech Career (And Where to Learn It!
Think Java is old news? Think again! 90% of Fortune 500 companies (yes, including Google, Amazon, and Netflix) run on Java (Oracle, 2025). From Android apps to banking systems, Java is the backbone of tech—and Sulekha IT Services is your fast track t