What is statistics?

What is statistics?
Statistics is the science of data collection, data analysis, data interpretation, data presentation and data organization. Statistics is a branch of mathematics under applied mathematics. Statistics deals with uncertainty and variation variables. The two major areas of statistics are inferential statistics and descriptive statistics.
Sir Ronald Aylmer Fisher is considered as the father of modern statistics. However, Prasanta Chandra Mahalanobis is considered as the father of Indian statistics.
Types of statistics
Statistics is descriptive or inferential. Let us understand both these concepts:
Descriptive statistics: In the descriptive statistics, the data is presented in a summarized manner. The sample data population is summarized using statistical techniques like mean, median or mode. The summarization can be done in the form of charts, graphs, to explain the summarization of a particular data set. Since its just descriptive, there is no need for any normalization.
Inferential statistics: Inferential statistic is applied over the descriptive statics. The descriptive statistics provides description of the data set and inferential statistics interprets the summary of the descriptions. Inferential statistics intends to test the hypothesis, examines the relation between variables, and make predictions.
Why is statistics important?
Statistics is an important aspect of modern math as this incredible science helps to draw inferences and conclusions from a given data set. We can understand how things change over time with statistics. Statistics also helps to make predictions of future behaviours and events.
Common statistical Analysis
There are a few commonly used statistical methods: Mean, Median, Mode, Range, Standard deviation, Regression, and Hypothesis testing.
Mean: Mean is calculated as an average by summing up the list of numbers and dividing by the number of items. It is the most straightforward statistical tool for determining the central point of a data set, or in other words, it is the measure of central tendency. Mean is the average of the data set. Data can be grouped or ungrouped. The method of calculating the mean depends on the nature of the data. The mean can also be arithmetic or geometric.
Arithmetic Formula: Sum of the numbers in a set/total quantity of the numbers of the set.
Geometric Formula: Multiply all the data set values and take a root of the number.
Median: The median is the middle value in a data set. Usually, a data set has odd or even numbers, organized from the most minor to the largest. In the case of odd numbers, the middle number is the median. In the case of even numbers, an average of the middle two numbers is calculated and considered the median. The median is also the calculation of the average, hence known as the measure of central tendency.
Mode: Mode is the number that occurs the maximum number of times. The value that has the highest frequency in a given data set is the mode. If there are two modes in a given data set, it is called bimodal. If there are three modes in a given data set, it is called trimodal. If there are four or more than four modes in a given set, then it is called a multi-modal.
Range: In statistics, range is a measurement of a data set's spread. It is the variance between a data set's highest and lowest values. The range is a commonly used variance in statistics.
Standard deviation (SD): SD measures the variation of a random variable from the mean. A low SD indicates that the values are close to the mean, and a high standard deviation implies that the values are spread out over an extensive range away from the mean.
Regression: Regression relates a dependable variable to one or more independent variables. It depicts the changes in the observer's dependent variable when one or more independent variables change.
Hypothesis testing: In hypothesis testing, the population parameter assumptions are tested. There are two hypotheses: null hypothesis and alternative hypothesis.
Conclusion: Statistics is a vast subject and has several real-life applications. If you want to learn more about the topic, enroll in our statistics course.
Find a course provider to learn Data Science
Java training | J2EE training | J2EE Jboss training | Apache JMeter trainingTake the next step towards your professional goals in Data Science
Don't hesitate to talk with our course advisor right now
Receive a call
Contact NowMake a call
+1-732-338-7323Take our FREE Skill Assessment Test to discover your strengths and earn a certificate upon completion.
Enroll for the next batch
Data Science-Python-ML-AI-Deep Learning (Hands-on Training)
- Jun 22 2026
- Online
Data Science-Python-ML-AI-Deep Learning (Hands-on Training)
- Jun 23 2026
- Online
Data Science-Python-ML-AI-Deep Learning (Hands-on Training)
- Jun 24 2026
- Online
Data Science-Python-ML-AI-Deep Learning (Hands-on Training)
- Jun 25 2026
- Online
Data Science-Python-ML-AI-Deep Learning (Hands-on Training)
- Jun 26 2026
- Online
Related blogs on Data Science to learn more
Data Science in 2026: The Hottest Skill of the Decade (And How Sulekha IT Services Helps You Master It!)
Data Science: The Career that’s everywhere—and Nowhere Near Slowing Down "From Netflix recommendations to self-driving cars, data science is the secret sauce behind the tech you use every day. And here’s the kicker: The U.S. alone will have 11.5 mill
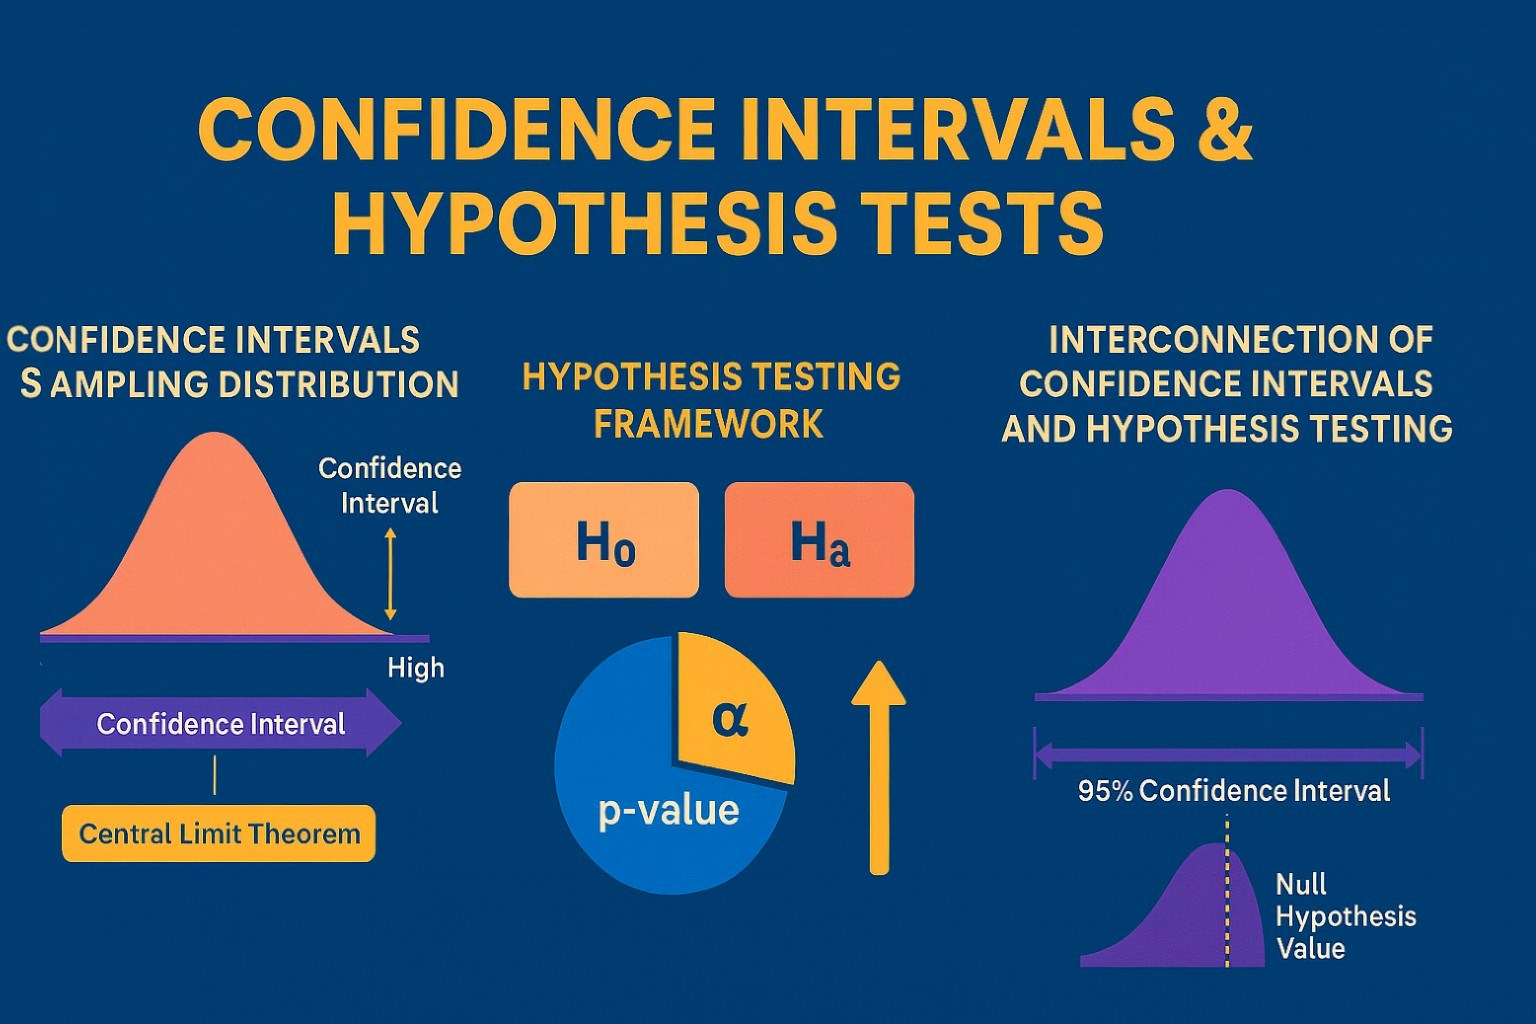
Confidence Intervals & Hypothesis Tests: The Data Science Path to Generalization
Learn how confidence intervals and hypothesis tests turn sample data into reliable population insights in data science. Understand CLT, p-values, and significance to generalize results, quantify uncertainty, and make evidence-based decisions.
Why Pursue Data Science Training?
Empower your career in a data-driven world. Learn why data science training is crucial for high-demand jobs, informed decisions, and staying ahead with essential skills.
Overview of data analytics VS data scientist
"Discover the key differences between data analytics and data science, explore top courses, job roles, salary expectations, and essential tools to build a successful career in these fields."
Career Launchpad: Data Science vs. Data Analytics- Know which course is right for you
Discover the key differences between Data Science and Data Analytics to choose the right course for your career. Explore roles, curriculum, salaries, and future prospects in this comprehensive guide.
What are Algorithms?
Discover the fundamentals of algorithms and data structures, their characteristics, types, and their crucial role in problem-solving and programming efficiency.

TEN ENTRY LEVEL JOBS IN IT FOR FRESHERS
Explore ten entry-level IT jobs for freshers, including roles like Help Desk Technician and Cloud Engineer, that require no prior experience but foundational IT knowledge. Discover exciting career paths in the technology sector that offer growth and
Twelve High Paying Jobs in New York City
Uncover twelve high-paying jobs in New York City, including roles like data scientist and public relations manager. Learn about their responsibilities and salary ranges.
What is Linear Algebra?
Discover the importance of linear algebra in various fields like data science, economics, and medicine. Understand its applications and why it's an essential skill for students and professionals alike.
TEN ENTRY LEVEL JOBS IN IT FOR FRESHERS
Discover ten entry-level IT jobs perfect for freshers, offering exciting career opportunities and a pathway to success in the tech industry.
Latest blogs on technology to explore

Drug Safety & Pharmacovigilance: Your 2026 Career Passport to a Booming Healthcare Industry!
Why This Course Is the Hottest Ticket for Science Grads & Healthcare Pros (No Lab Coat Required!)" The Exploding Demand for Drug Safety Experts "Did you know? The global pharmacovigilance market is set to hit $12.5B by 2026 (Grand View Research, 202

Launch Your Tech Career: Why Mastering AWS Foundation is Your Golden Ticket in 2026
There’s one skill that can open all those doors — Amazon Web Services (AWS) Foundation
Data Science in 2026: The Hottest Skill of the Decade (And How Sulekha IT Services Helps You Master It!)
Data Science: The Career that’s everywhere—and Nowhere Near Slowing Down "From Netflix recommendations to self-driving cars, data science is the secret sauce behind the tech you use every day. And here’s the kicker: The U.S. alone will have 11.5 mill

Salesforce Admin in 2026: The Career Goldmine You Didn’t Know You Needed (And How to Break In!)
The Salesforce Boom: Why Admins Are in Crazy Demand "Did you know? Salesforce is the 1 CRM platform worldwide, used by 150,000+ companies—including giants like Amazon, Coca-Cola, and Spotify (Salesforce, 2025). And here’s the kicker: Every single one

Python Power: Why 2026 Belongs to Coders Who Think in Python
If the past decade was about learning to code, the next one is about coding smarter. And in 2026, the smartest move for any IT enthusiast is learning Python — the language that powers AI models, automates the web, and drives data decisions across ind

The Tableau Revolution of 2025
"In a world drowning in data, companies aren’t just looking for analysts—they’re hunting for storytellers who can turn numbers into decisions. Enter Tableau, the #1 data visualization tool used by 86% of Fortune 500 companies (Tableau, 2024). Whether

From Student to AI Pro: What Does Prompt Engineering Entail and How Do You Start?
Explore the growing field of prompt engineering, a vital skill for AI enthusiasts. Learn how to craft optimized prompts for tools like ChatGPT and Gemini, and discover the career opportunities and skills needed to succeed in this fast-evolving indust

How Security Classification Guides Strengthen Data Protection in Modern Cybersecurity
A Security Classification Guide (SCG) defines data protection standards, ensuring sensitive information is handled securely across all levels. By outlining confidentiality, access controls, and declassification procedures, SCGs strengthen cybersecuri

Artificial Intelligence – A Growing Field of Study for Modern Learners
Artificial Intelligence is becoming a top study choice due to high job demand and future scope. This blog explains key subjects, career opportunities, and a simple AI study roadmap to help beginners start learning and build a strong career in the AI
Java in 2026: Why This ‘Old’ Language Is Still Your Golden Ticket to a Tech Career (And Where to Learn It!
Think Java is old news? Think again! 90% of Fortune 500 companies (yes, including Google, Amazon, and Netflix) run on Java (Oracle, 2025). From Android apps to banking systems, Java is the backbone of tech—and Sulekha IT Services is your fast track t