What are some advanced visualization techniques I should be aware of?
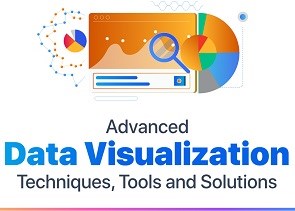
Data visualization tools are in high demand within organizations because they can transform complex data into easily comprehending visual formats. Organizations worldwide generate vast amounts of data, and these tools are utilized to streamline the process quickly to make these data actionable insights. These tools act as a bridge between raw data and actionable data to foster informed decision-making.
Moreover, data visualization tools like Tableau, Power BI (Microsoft Power BI), QlikView, Qlik Sense, and many others make it possible to identify patterns and trends. Due to this, data visualization tools have become indispensable assets, driving efficiency, innovation, and competitiveness across a wide range of industries.
What is data Visualization?
Data visualization visualizes information through graphs, charts, maps, or another visual format. This visual representation of information will be more understandable, accessible, and actionable.
It is a powerful tool for conveying information, facilitating data-driven decision-making, and effectively communicating insights to various stakeholders.
Key feature of data visualization:
- Simplicity and Clarity
- Insight Generation
- Representation Diversity
- Aesthetic Design
- Data Integrity
- Audience Adaptation
These are the crucial features of data visualization; apart from these, it offers various advantages. These features collectively contribute to the effectiveness of data visualization in conveying information, facilitating analysis, and driving informed decision-making within organizations.
Now, we shall discuss some advantages of visualization techniques and their benefits. Here are some advanced visualization techniques you should be aware of:
- Parallel Coordinates: Each data point is plotted as a polyline along a collection of parallel axes, with each axis corresponding to a separate variable. This allows you to discover links and patterns among variables.
- T-SNE (t-Distributed Stochastic Neighbor embedding): The dimensionality reduction method known as T-SNE. It is especially beneficial for visualizing high-dimensional data in lower dimensions. It seeks to retain local structures while representing the similarities between data points.
- Heatmaps and Hierarchical Clustering: Heatmaps show data as a grid, with each cell colored according to the value of the data. Combined with hierarchical clustering, you can find patterns and relationships in massive datasets, which assemble related elements into a tree-like structure.
- Chord Diagrams: One may show the connections between different data points using chord diagrams. They are frequently employed to depict relationships between things, such as exchanges between users in social networks.
- Sankey Diagrams: Sankey diagrams depict the exchange of resources or quantities among various entities. They are helpful for illuminating processes, such as client journey analysis or energy flow in a system.
- Network Graphs: Nodes joined by edges represent relationships between entities in network graphs (node-link diagrams). They are frequently used to symbolize social networks, transportation networks, and other systems.
- Word Clouds: Word clouds are visual representations of the frequency of terms in a dataset appearing larger, denoting more frequent occurrences. They may be sufficient for swiftly understanding text data despite being straightforward.Streamgraphs: Streamgraphs are used to show how data evolves. They help demonstrate how the makeup of specific categories varies over time.
- 3D Visualization: While often used with caution due to potential distortions, 3D visualization can provide a way to explore three-dimensional data when used appropriately. Techniques like scatterplot matrices and 3D bar charts fall into this category.
- Virtual Reality (VR) and Augmented Reality (AR) Visualization: Immersive and interactive data exploration is made possible by emerging technologies such as VR and AR. These tools can help with complex spatial data or simulations.
- Interactive Dashboards: Users may edit and study data at their own pace with the help of interactive dashboards made with tools like Tableau, Power BI, or custom web-based solutions.
- Animated Visualizations: Animation can depict how data evolves or switches between states. It's a potent method of communicating dynamic patterns.
Remember that the technique you use should be based on the nature of your data, the insights you want to express, and the audience you're aiming for. Experimenting with advanced techniques can assist you in uncovering hidden patterns and links in your data.
Take the next step towards your professional goals in Data Visualization Development
Don't hesitate to talk with our course advisor right now
Receive a call
Contact NowMake a call
+1-732-338-7323Latest blogs on technology to explore

Cyber Security in 2025: The Golden Ticket to a Future-Proof Career
Cyber security jobs are growing 35% faster than any other tech field (U.S. Bureau of Labor Statistics, 2024)—and the average salary is $100,000+ per year! In a world where data breaches cost businesses $4.45 million on average (IBM, 2024), cyber secu

SAP SD in 2025: Your Ticket to a High-Flying IT Career
In the fast-paced world of IT and enterprise software, SAP SD (Sales and Distribution) is the secret sauce that keeps businesses running smoothly. Whether it’s managing customer orders, pricing, shipping, or billing, SAP SD is the backbone of sales o

SAP FICO in 2025: Salary, Jobs & How to Get Certified
AP FICO professionals earn $90,000–$130,000/year in the USA and Canada—and demand is skyrocketing! If you’re eyeing a future-proof IT career, SAP FICO (Financial Accounting & Controlling) is your golden ticket. But where do you start? Sulekha IT Serv

Train Like an AI Engineer: The Smartest Career Move You’ll Make This Year!
Why AI Engineering Is the Hottest Skillset Right Now From self-driving cars to chatbots that sound eerily human, Artificial Intelligence is no longer science fiction — it’s the backbone of modern tech. And guess what? Companies across the USA and Can
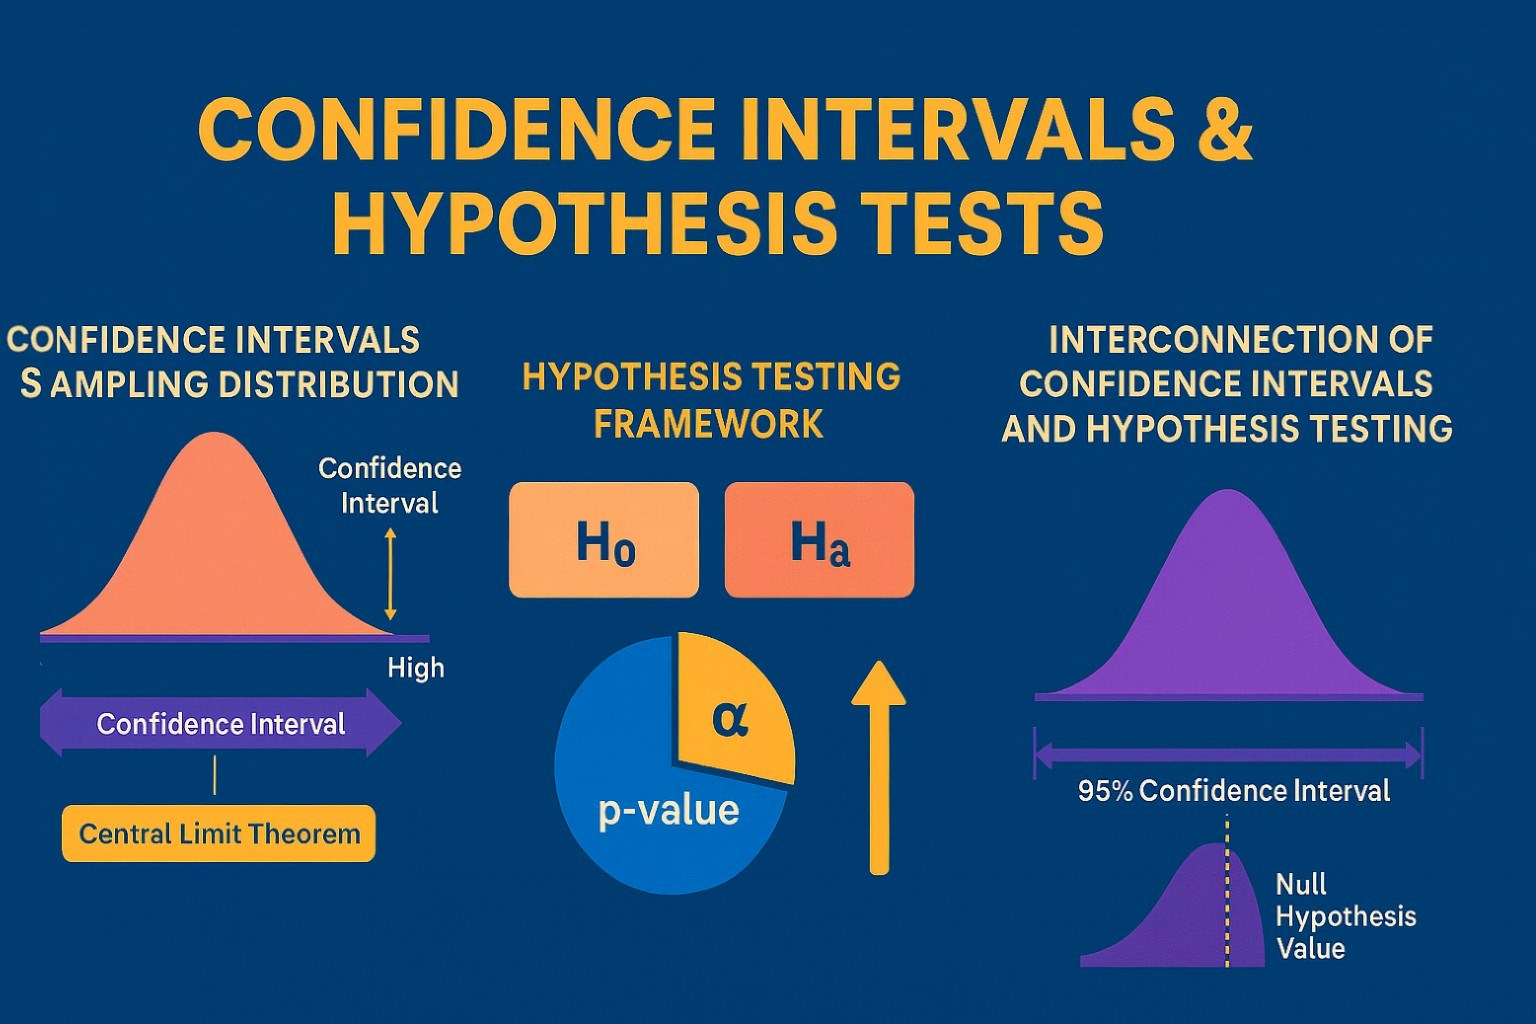
Confidence Intervals & Hypothesis Tests: The Data Science Path to Generalization
Learn how confidence intervals and hypothesis tests turn sample data into reliable population insights in data science. Understand CLT, p-values, and significance to generalize results, quantify uncertainty, and make evidence-based decisions.
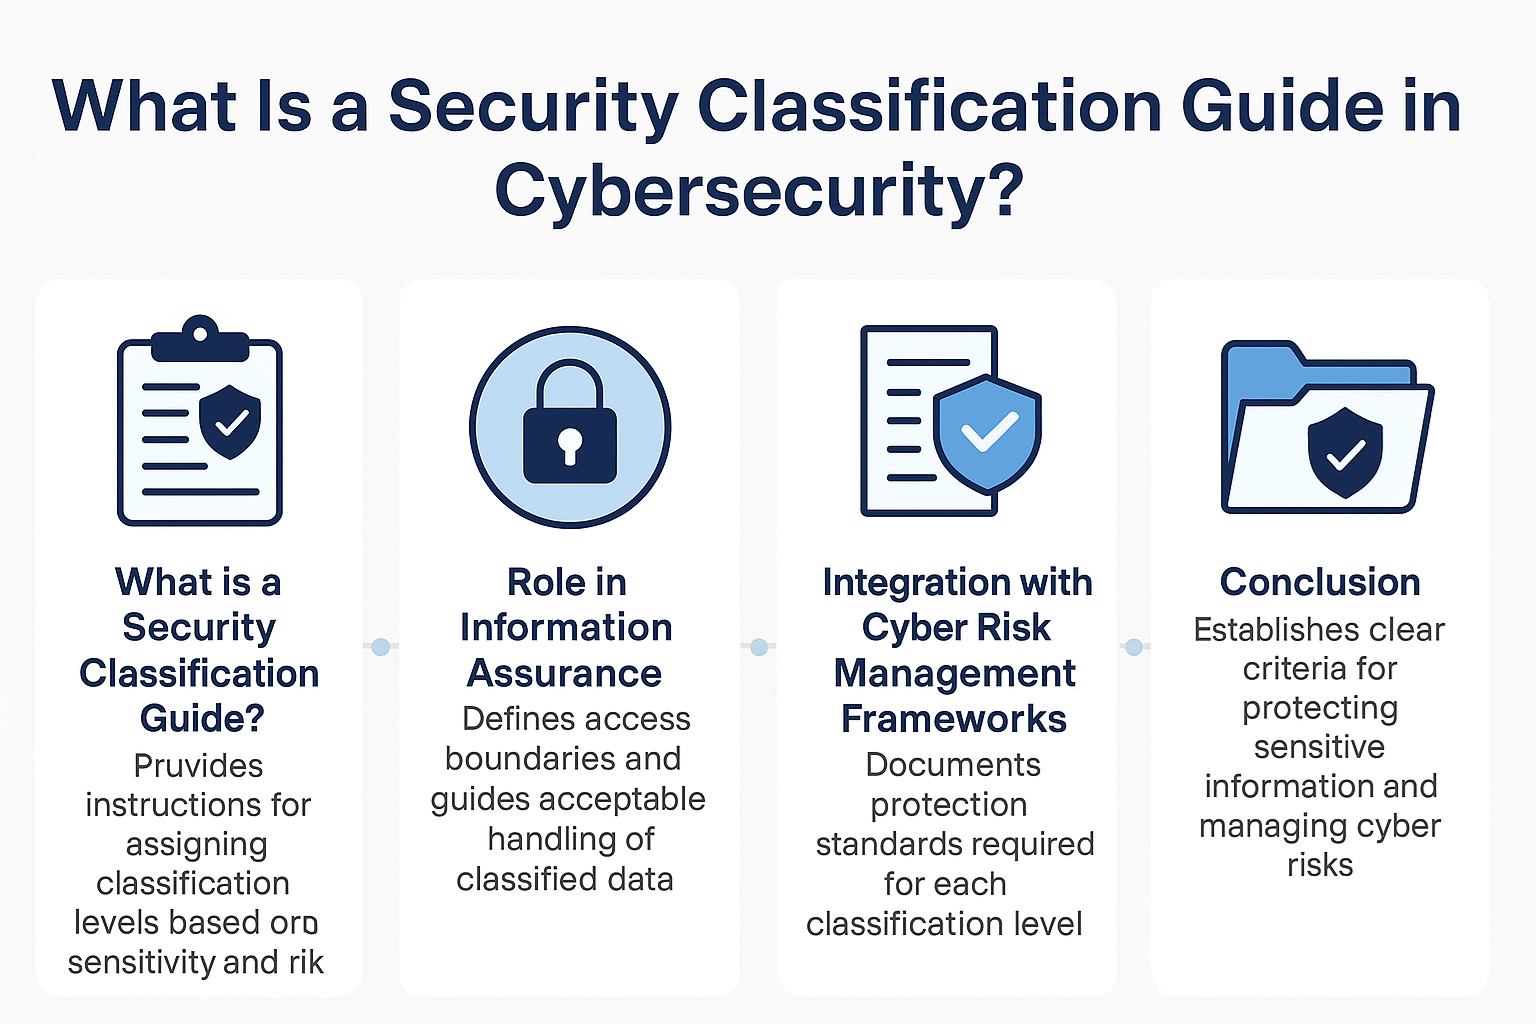
What Is a Security Classification Guide in Cybersecurity?
A Security Classification Guide (SCG) defines how to categorize information assets by sensitivity, with clear instructions from authorized officials to ensure consistent, compliant data handling.
Artificial Intelligence – Field of Study
Explore how Artificial Intelligence blends Machine Learning, Deep Learning, NLP, and Computer Vision to build intelligent systems that learn, reason, and decide. Discover real world applications, ethics, and booming career scope as AI education deman
Understanding Artificial Intelligence: Hype, Reality, and the Road Ahead
Explore the reality of Artificial Intelligence (AI) — its impact, how it works, and its potential risks. Understand AI's benefits, challenges, and how to navigate its role in shaping industries and everyday life with expert training programs
How Much Do Healthcare Administrators Make?
Discover how much healthcare administrators make, the importance of healthcare, career opportunities, and potential job roles. Learn about salary ranges, career growth, and training programs with Sulekha to kickstart your healthcare administration jo

How to Gain the High-Income Skills Employers Are Looking For?
Discover top high-income skills like software development, data analysis, AI, and project management that employers seek. Learn key skills and growth opportunities to boost your career.