SQL BI or SQL Business Intelligence provides a comprehensive platform to empower organizations to build and set up scalable, secure, & manageable BI solutions.
In this article, you will learn how to use SQL BI systems to collect, analyze & visualize important data as well as to sustain better business decision making.
Well, today, companies rely more and more on analytics to identify patterns and trends within their data and for valuable information needed to improve decision-making. For users to make most out of this information – specifically business users -- tools and features must be interactive and comparatively easy to apply. BI has been a principal focus for Microsoft as it has tried hard to make the SQL Server a practical and effective enterprise database platform.
The perfect BI system can offer a business with crucial information by means of collecting disparate data/information from varied sources and over long time periods and making it likely to analyze the data together. SQL BI tools & plug-ins like Power View enable users to get access to the back end of the SQL server in order to find helpful business data, construct reports & visuals, and share data easily with other users. Besides, an SQL Server BI system tends to support decision making in firms of all sizes; however, it is not always the most economical or sensible choice.
It is important that consumers get to know comprehensively about SQL BI, business analytics and different data visualization tools & features coupled with expert recommendations to make a buying decision that is just right for their organization.
Benefit greatly from SQL BI features
Each and every new version of the SQL server has presented its users with new features which expand BI capabilities and smooth the progress of BI reporting & analysis.
Let us have a look at the key features and the ways they enhance data visualization, data sharing & ultimately, decision-making abilities in business.
Power View helps improve data visualization and decision-making
Power View appears to be a handy BI reporting tool which enables users to create reports and interact with numerous views of data.
SQL server analytics tools boost reporting and visuals
Well, business as well as IT users enjoy a variety of options as far as SQL business intelligence tools are concerned. They should explore SQL Server Reporting Services, GeoFlow, PowerPivot, and other tools and see what they have in store for them and whether or not they would be appropriate for their organization.
Overview of SQL BI Manager
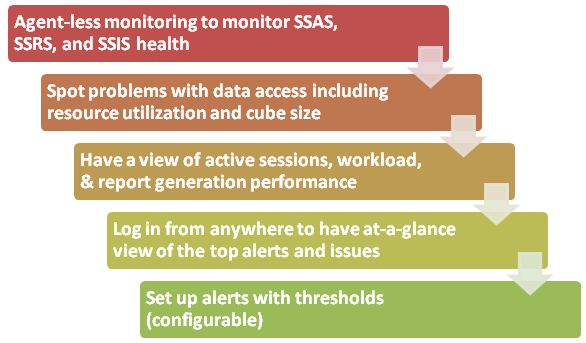
Briefly explained below are the above-mentioned features:
BI Monitoring that involves monitoring SSAS, SSRS and SSIS health
Monitors health and availability of the BI environment that includes SQL Server Analysis Services, SQL Server Integration Services and SQL Server Reporting Services; ensures uptime & identifies issues too quickly
Activity View
View the active sessions on your SSAS server including username, cube, last command, session start time, & so much more. Moreover, you can have a look at report execution performance from the SSRS servers.
Data View
Gain access to data like resource utilization, report generation performance and cube sizes from your Business Intelligence environment and identify the issues before they become too painful.
Configurable Alerts
You can set alerts & email notifications with the configurable threshold levels in order to keep yourself informed of just the relevant information.
Dashboard (Web-based)
Log in from anywhere to quickly confirm the status of the monitored SQL Business Intelligence server instances. Customizable web dashboard offers at-a-glance status of the top issues & alerts with simple drill down capabilities so that you can spot as well as diagnose issues quickly.
Find a course provider to learn SQL BI
Java training | J2EE training | J2EE Jboss training | Apache JMeter trainingTake the next step towards your professional goals in SQL BI
Don't hesitate to talk with our course advisor right now
Receive a call
Contact NowMake a call
+1-732-338-7323Enroll for the next batch
Power BI and SQL Course
- Jun 22 2026
- Online
Power BI and SQL Course
- Jun 23 2026
- Online
Power BI and SQL Course
- Jun 24 2026
- Online
Power BI and SQL Course
- Jun 25 2026
- Online
Power BI and SQL Course
- Jun 26 2026
- Online
Latest blogs on technology to explore

Drug Safety & Pharmacovigilance: Your 2026 Career Passport to a Booming Healthcare Industry!
Why This Course Is the Hottest Ticket for Science Grads & Healthcare Pros (No Lab Coat Required!)" The Exploding Demand for Drug Safety Experts "Did you know? The global pharmacovigilance market is set to hit $12.5B by 2026 (Grand View Research, 202

Launch Your Tech Career: Why Mastering AWS Foundation is Your Golden Ticket in 2026
There’s one skill that can open all those doors — Amazon Web Services (AWS) Foundation
Data Science in 2026: The Hottest Skill of the Decade (And How Sulekha IT Services Helps You Master It!)
Data Science: The Career that’s everywhere—and Nowhere Near Slowing Down "From Netflix recommendations to self-driving cars, data science is the secret sauce behind the tech you use every day. And here’s the kicker: The U.S. alone will have 11.5 mill
Salesforce Admin in 2026: The Career Goldmine You Didn’t Know You Needed (And How to Break In!)
The Salesforce Boom: Why Admins Are in Crazy Demand "Did you know? Salesforce is the 1 CRM platform worldwide, used by 150,000+ companies—including giants like Amazon, Coca-Cola, and Spotify (Salesforce, 2025). And here’s the kicker: Every single one

Python Power: Why 2026 Belongs to Coders Who Think in Python
If the past decade was about learning to code, the next one is about coding smarter. And in 2026, the smartest move for any IT enthusiast is learning Python — the language that powers AI models, automates the web, and drives data decisions across ind

The Tableau Revolution of 2025
"In a world drowning in data, companies aren’t just looking for analysts—they’re hunting for storytellers who can turn numbers into decisions. Enter Tableau, the #1 data visualization tool used by 86% of Fortune 500 companies (Tableau, 2024). Whether

From Student to AI Pro: What Does Prompt Engineering Entail and How Do You Start?
Explore the growing field of prompt engineering, a vital skill for AI enthusiasts. Learn how to craft optimized prompts for tools like ChatGPT and Gemini, and discover the career opportunities and skills needed to succeed in this fast-evolving indust
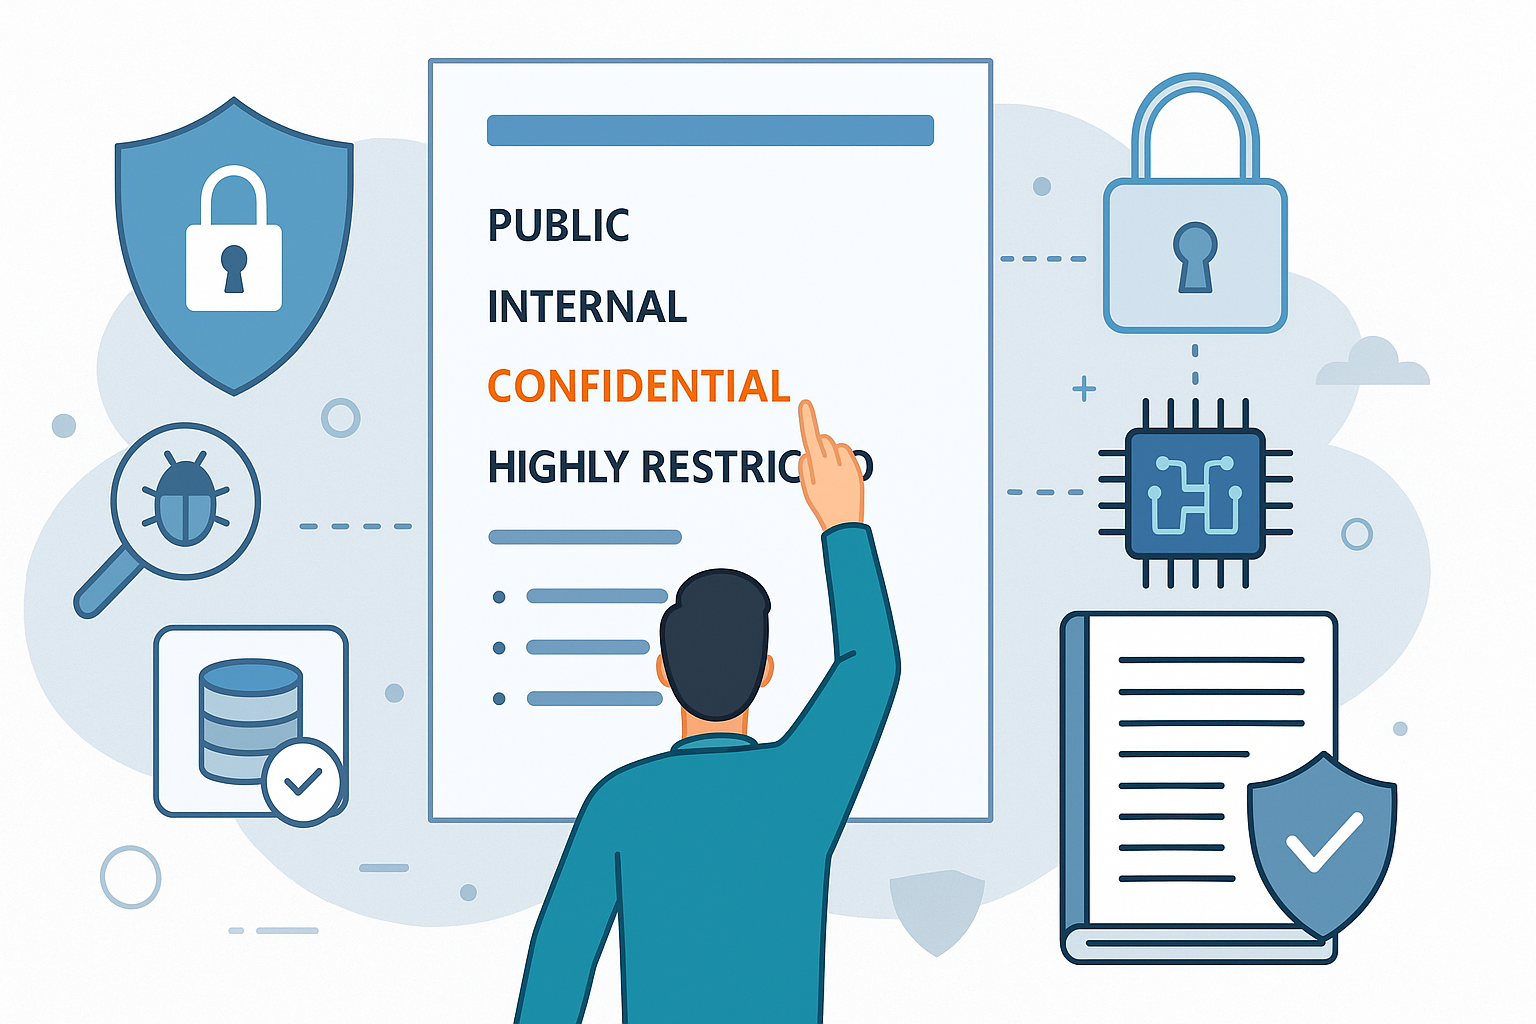
How Security Classification Guides Strengthen Data Protection in Modern Cybersecurity
A Security Classification Guide (SCG) defines data protection standards, ensuring sensitive information is handled securely across all levels. By outlining confidentiality, access controls, and declassification procedures, SCGs strengthen cybersecuri

Artificial Intelligence – A Growing Field of Study for Modern Learners
Artificial Intelligence is becoming a top study choice due to high job demand and future scope. This blog explains key subjects, career opportunities, and a simple AI study roadmap to help beginners start learning and build a strong career in the AI
Java in 2026: Why This ‘Old’ Language Is Still Your Golden Ticket to a Tech Career (And Where to Learn It!
Think Java is old news? Think again! 90% of Fortune 500 companies (yes, including Google, Amazon, and Netflix) run on Java (Oracle, 2025). From Android apps to banking systems, Java is the backbone of tech—and Sulekha IT Services is your fast track t