What topics are covered for a data analyst course?
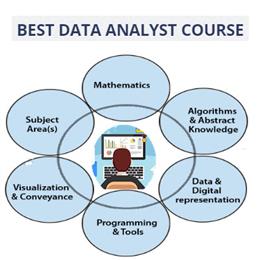
An Overview of Data Analyst Course Content
A data analysis course covers various data analyst topics, from understanding key data analysis subjects to mastering essential tools, including statistical analysis, machine learning, SQL, Python, and data visualization. Data analysts play a critical role in organizations of all sizes, whether small, medium, large, or corporate. Data analysts gather, analyze, and interpret data to drive strategic and operational success in technology-based companies. A comprehensive data analyst syllabus equips learners with the skills to make data-driven decisions under uncertain conditions and create models supporting effective business outcomes. The syllabus or curricula focuses on developing skills to make data-driven decisions, even under uncertain or ambiguous conditions, and creating models for effective decision-making in a business context.
Below is a detailed data analytics course syllabus covering key concepts, tools, and techniques. While this syllabus is a representative outline, it may vary based on the learners- beginners, intermediate, and professionals or training providers. It is crucial to note that the syllabus, content, and format are subject to change.
This guide explores what topics are included in a data analysis class, providing insights into essential data analyst course subjects and industry-relevant skills.
Additional Skills and Tools for Data Analysts
A data analyst's primary responsibility is not coding as much as a data scientist, but they must know statistical programming languages like R and Python. Familiarity with SQL (Structured Query Language) is essential to perform data queries and analysis. While Excel is not as powerful as R programming or Python, its usage remains invaluable for working on smaller data sets and for startups.
Data visualization is another integral part of a data analyst's role. Mastery of tools like Tableau, Power BI, and MS Excel for creating actionable insights is crucial. Additionally, business presentation skills are required to effectively communicate findings to stakeholders.
The data analyst course Syllabus are:
To become a successful data analyst, you need a strong foundation in data manipulation tools like SQL, Python, and R and proficiency in data visualization platforms such as Tableau or Power BI. Additionally, analytical thinking, statistical knowledge, and effectively communicating insights are essential for making data-driven decisions. Here is a quick review:
1. Statistics Programming
2. Probability and statistics
3. Data analytics with R
4. SAS
5. Tableau
6. SQL
7. Power BI
8. Python
Below are the recent trends and updated modules of the data analyst course syllabus 2025 covering core concepts, advanced tools, techniques, and skills.
1. Data and overview of data types
- Introduction to Data Types
- Numerical parameters to represent data
a. Mean
b. Mode
c. Median
d. Sensitivity
e. Information Gain
f. Entropy
- Statistical parameters to represent data
2. Probability
- Uses of probability
- Need of probability
- Bayesian Inference
- Density Concepts
- Normal Distribution Curve
3. Statistics
- Point Estimation
- Confidence Margin
- Hypothesis Testing
- Levels of Hypothesis Testing
4. Data clustering
- Association and Dependence
- Causation and Correlation
- Covariance
- Simpson’s Paradox
- Clustering Techniques
5. Data testing techniques
- Parametric Test
- Parametric Test Types
- Non- Parametric Test
- Experimental Designing
- A/B testing
6. Regression modelling and Distributions
- Probability distributions and regression analysis
- Linear regression analysis and model
- Normal distribution and binomial distribution
- Logistic and Regression Techniques
- Problem of Collinearity
- WOE and IV
- Residual Analysis
- Heteroscedasticity
- Homoscedasticity
7. Introduction to R programming
- Various data types in R
- Built-in functions in R
- Subsetting methods
- Data cleansing
- Data inspection
- Data import from excel and other spreadsheets and text files into R
- Data import from SPSS, sas7bdat
- Installation of packages for database import
- Fundamentals of Web scrapping
- Summarize data
8. Exploratory data analysis
- Overview of EDA
- Understand and implement EDA on various data sets
- Understand the EDA functions
- Work with box plots, segment plots etc.
9. Data visualization in R
- Data visualization and graphical functions and representations in R
- Plotting various graphs like tableplot, histogram, boxplot
- Understand the working of Deducer, and R commander
- Understand the graphical functions in R
- Customize graphical parameters to improvise the plots
- Overview to spatial plots
10. Data mining and clustering techniques
- Introduction to data mining
- Overview of machine learning
- Machine learning algorithms – supervised and unsupervised
- K-Means clustering technique
- Association rule
- Sentiment analysis
- Predictive analysis techniques
- Annova technique
11. Decision Trees and Random forest techniques
- Concept of decision trees
- Classification rules of decision trees
- Understand the algorithms for creating decision trees
- Create perfect decision trees
- Concepts and features of decision trees
- Working on Random forest
- Entropy and gaining information
12. SAS
- Understand the implementation of SAS and the use cases
- Understand the different data types in SAS
- Understand data step and procedural step
- Understand the basic procedural steps
- Overview of SAS GUI
- Introduction to SAS Window and its contents
- Use of formats and informats in SAS
- Create instream SAS Data set
13. Process and Integrate with data
- Data import in SAS
- Work with permanent and temporary data sets
- Set and merge statements
- Manipulate influx of data sets into SAS
14. Customize dataset
- Program with SAS data sets
- Simplify processing with SAS using conditional and iterative processing
- Date and time functions
- Numeric and character functions
- SAS Arrays
- SAS statistical procedures
15. Advanced statistical procedures with SAS
- Overview of clustering
- Concepts of hierarchical clustering
- Concepts of Non-Hierarchical clustering(K-clustering)
- Simple, multiple and logistic regression
16. Data optimization variables
- Concepts of data optimization and optimization models
- Introduction to ODS and its benefits
- Generate rtf, pdf, html, and doc files
17. SQL
- Work with select statements and other select statement clauses
- Work with JOINS and UNIONS
- Create new tables
- CASE expression
18. SAS Macros
- Overview and benefits of using SAS Macros
- Macro variables
- Macro code constituents
- Positional parameters to Macros
19. Data visualization
- Introduction to data visualization
- Introduction to Tableau 10
- Data blending and establishing a connection
20. Visual analytics
- Manage metadata and extracts
- Data granularity using marks card
- Work with sort, filter and grouping (static and dynamic)
- Graphic visualization
21. Dashboard, stories and Mapping
- Introduction and creation of a dashboard layout
- Introduction to story point
- Introduction to maps and web mapping services
- Design dashboard for devices
- Interact using action
- Create background images
- Create polygon maps
- Work with custom geocoding
22. Charts in Tableau
- Work with Gantt, waterfall, pareto charts
- Work with control charts, funnel charts, box and whisker’s plots
23. Integration of Tableau, R and Hadoop
- Introduction to big data, R and Hadoop concepts
- Integrate R with Hadoop
- Integrate Tableau with R
- Integrate visualization using Tableau
24. Advanced Excel for Data Analysis
- Power Query and Power Pivot.
- Advanced Excel Formulas (e.g., INDEX-MATCH, ARRAY formulas).
- Automating Reports with VBA (Visual Basic for Applications).
- Dynamic dashboards using Excel.
- Data Cleaning and Manipulation Techniques.
25. Python for Data Analytics
- Python Basics for Beginners: Variables, Loops, and Functions.
- Libraries for Data Analytics: Pandas, NumPy, Matplotlib, and Seaborn.
- Advanced Python Techniques:
- Data Wrangling and Transformation.
- Building Predictive Models with Scikit-learn.
- Automation and Scripting for Repetitive Tasks.
26. Big Data and Cloud Computing Basics
- Introduction to Big Data: Characteristics and Use Cases.
- Working with Hadoop and Spark Ecosystem.
- Cloud Platforms: Basics of AWS, Azure, and Google Cloud for Data Analysis.
- Querying Data on Cloud using Google BigQuery and Snowflake.
27. Introduction to Artificial Intelligence and Machine Learning
- Overview of AI in Data Analytics.
- Introduction to Machine Learning Algorithms: Decision Trees, Random Forests, KNN.
- Understanding Neural Networks and Deep Learning Basics.
- AI-powered Data Analysis Tools.
28. Data Ethics and Compliance
- Understanding Data Privacy Laws: GDPR, HIPAA, and CCPA.
- Ethical Issues in Data Collection and Analysis.
- Bias Detection and Prevention in Data Analytics.
- Data Security Best Practices.
29. No-Code and Low-Code Platforms for Analytics
- Introduction to No-Code Tools like Airtable, Zapier, and Bubble.
- Using Power BI with DAX (Data Analysis Expressions).
- Workflow Automation for Non-Technical Analysts.
30. Soft Skills for Data Analysts
- Effective Communication for Presenting Data Insights.
- Storytelling with Data: Building Engaging Narratives.
- Stakeholder Management and Cross-Functional Collaboration.
- Problem-solving and Critical Thinking for Business Analytics.
31. Emerging Technologies in Data Analytics
- Introduction to Blockchain Analytics.
- IoT (Internet of Things) Data Analysis.
- Real-Time Data Processing with Kafka.
- Quantum Computing: A Glimpse into the Future of Data Analytics.
Why We Add Data Analyst course Modules?
Relevance: These modules address current and future needs in the data analytics industry.
Comprehensiveness: Learners gain a well-rounded understanding of foundational and advanced topics.
Marketability: Skills in AI, Big Data, Python, and Cloud Computing enhance career prospects.
Future-Proofing: Keeping up with trends ensures learners remain competitive in the job market.
Additional Career Benefits of This Course
Completing this comprehensive data analyst course syllabus prepares learners for various career paths:
Data Visualization Specialist: Creating advanced dashboards and visualizations.
Business Intelligence Analyst: Driving decisions through actionable insights.
Operations Analyst: Improving efficiency with data-driven strategies.
Popular Certifications to Boost Your Career
Certifications are an excellent way to validate your skills. Consider these options:
1. Google Data Analytics Certificate.
2. Tableau Desktop Specialist Certification.
3. Microsoft Power BI Certification
4. Generative AI For Data Analysts Specialization Training
What Learners gain through our Data analyst course:
Proficiency in data analysis tools like R, Python, and Tableau.
A solid understanding of statistical techniques and real-world applications.
Industry-relevant skills such as data-driven decision-making and business storytelling.
Statistical report- why choose to learn Data Analyst course
The U.S. Bureau of Labor Statistics projects a 36% increase in employment for data scientists from 2023 to 2033, indicating a much faster growth rate than the average for all occupations.
Market Expansion: The global data analytics market is expected to grow from $7.03 billion in 2023 to $303.4 billion by 2030, reflecting a compound annual growth rate (CAGR) of 27.6%.
Salary: According to Glassdoor, Data Analyst salaries in the United States range from $73k to 170k per year.
In conclusion,
The Data Analyst course equips learners with comprehensive knowledge and practical skills to excel in this growing field. From mastering statistical techniques and programming languages like R and Python to leveraging cutting-edge tools like Tableau and Power BI, the curriculum ensures learners are industry-ready. With a promising job outlook and increasing demand across industries, this course provides a robust foundation for a rewarding career in data analytics.
Find a course provider to learn Apache Cassandra
Java training | J2EE training | J2EE Jboss training | Apache JMeter trainingTake the next step towards your professional goals in Apache Cassandra
Don't hesitate to talk with our course advisor right now
Receive a call
Contact NowMake a call
+1-732-338-7323Enroll for the next batch
cassandra Online Course Training
- Jul 8 2026
- Online
cassandra Online Course Training
- Jul 9 2026
- Online
cassandra Online Course Training
- Jul 10 2026
- Online
Latest blogs on technology to explore

Drug Safety & Pharmacovigilance: Your 2026 Career Passport to a Booming Healthcare Industry!
Why This Course Is the Hottest Ticket for Science Grads & Healthcare Pros (No Lab Coat Required!)" The Exploding Demand for Drug Safety Experts "Did you know? The global pharmacovigilance market is set to hit $12.5B by 2026 (Grand View Research, 202

Launch Your Tech Career: Why Mastering AWS Foundation is Your Golden Ticket in 2026
There’s one skill that can open all those doors — Amazon Web Services (AWS) Foundation
Data Science in 2026: The Hottest Skill of the Decade (And How Sulekha IT Services Helps You Master It!)
Data Science: The Career that’s everywhere—and Nowhere Near Slowing Down "From Netflix recommendations to self-driving cars, data science is the secret sauce behind the tech you use every day. And here’s the kicker: The U.S. alone will have 11.5 mill

Salesforce Admin in 2026: The Career Goldmine You Didn’t Know You Needed (And How to Break In!)
The Salesforce Boom: Why Admins Are in Crazy Demand "Did you know? Salesforce is the 1 CRM platform worldwide, used by 150,000+ companies—including giants like Amazon, Coca-Cola, and Spotify (Salesforce, 2025). And here’s the kicker: Every single one

Python Power: Why 2026 Belongs to Coders Who Think in Python
If the past decade was about learning to code, the next one is about coding smarter. And in 2026, the smartest move for any IT enthusiast is learning Python — the language that powers AI models, automates the web, and drives data decisions across ind

The Tableau Revolution of 2025
"In a world drowning in data, companies aren’t just looking for analysts—they’re hunting for storytellers who can turn numbers into decisions. Enter Tableau, the #1 data visualization tool used by 86% of Fortune 500 companies (Tableau, 2024). Whether

From Student to AI Pro: What Does Prompt Engineering Entail and How Do You Start?
Explore the growing field of prompt engineering, a vital skill for AI enthusiasts. Learn how to craft optimized prompts for tools like ChatGPT and Gemini, and discover the career opportunities and skills needed to succeed in this fast-evolving indust
How Security Classification Guides Strengthen Data Protection in Modern Cybersecurity
A Security Classification Guide (SCG) defines data protection standards, ensuring sensitive information is handled securely across all levels. By outlining confidentiality, access controls, and declassification procedures, SCGs strengthen cybersecuri

Artificial Intelligence – A Growing Field of Study for Modern Learners
Artificial Intelligence is becoming a top study choice due to high job demand and future scope. This blog explains key subjects, career opportunities, and a simple AI study roadmap to help beginners start learning and build a strong career in the AI
Java in 2026: Why This ‘Old’ Language Is Still Your Golden Ticket to a Tech Career (And Where to Learn It!
Think Java is old news? Think again! 90% of Fortune 500 companies (yes, including Google, Amazon, and Netflix) run on Java (Oracle, 2025). From Android apps to banking systems, Java is the backbone of tech—and Sulekha IT Services is your fast track t