HP ALM is more than a just a test management tool!

HP ALM is popularly known as Quality Center, a test management and Application Life Cycle Management Tool (ALM). It is no longer just a test management tool but a platform that supports various phases of the software development life cycle. HP Quality Center helps us to manage various project milestones, resources, and deliverables and helps to keep definite track of the health of projects, standards that allow Product owners to gauge the current status of the product. It is important to understand history, architecture and Quality Center Workflow.
Expertise in HP ALM allows users to generate reports and graphs at any time during the software development process. Project reports in ALM enable users to design and generate customized report by accessing the project information which will help stakeholders in taking informed decisions. Users can create graphs or project reports in the Analysis View module. They can also save the graphs and reports in the Analysis View module for future references.
Analysis View
Analysis view module enables users to create, manage and view analysis items such as graphs, project reports and Excel reports.
Entity Graph: ALM enables users to generate graphs based on certain entity type such as requirements, tests, test instances, test runs or defects. For each entity, different graph types are available that are listed below.
Requirement
- Progress Graph
- Coverage Graph
- Summary Graph
- Trend Graph
Test Plan
- Summary Graph
- Progress Graph
Test Lab
- Test Set Progress Graph
- Test Set Summary Graph
- Test Run Summary Graph
Defects
- Age Graph
- Progress Graph
- Summary Graph
- Trend Graph
Business View Graph
A business view graph involves only those project entity fields that represent information which is useful from a business perspective.
Business views can either be based on single entities such as Requirement or Defects, or it can be based on more complex relationships between entities such as Defects with Linked Requirements/defects with linked tests.
Though on a high level, both business view graph and entity graph look at the same, at this juncture let us understand basic different between entity graph and business view graph.
Entity Graph | Business View Graph |
This graph is strictly associated with only one type of entity (defect or Requirement or Test) in ALM | This Graph is either based on single entity or based on relationship between defect and Requirement or defect and tests |
The fields involved are those that are contained within that specific entity. | The fields involved are those that represent useful information from a business perspective. |
Find a course provider to learn HP ALM
Java training | J2EE training | J2EE Jboss training | Apache JMeter trainingTake the next step towards your professional goals in HP ALM
Don't hesitate to talk with our course advisor right now
Receive a call
Contact NowMake a call
+1-732-338-7323Enroll for the next batch
HP ALM Certification Training Online
- Dec 15 2025
- Online
HP ALM Certification Training Online
- Dec 16 2025
- Online
HP ALM Certification Training Online
- Dec 17 2025
- Online
Hp Alm Training Courses
- Dec 18 2025
- Online
Hp Alm Training Courses
- Dec 19 2025
- Online
Latest blogs on technology to explore

From Student to AI Pro: What Does Prompt Engineering Entail and How Do You Start?
Explore the growing field of prompt engineering, a vital skill for AI enthusiasts. Learn how to craft optimized prompts for tools like ChatGPT and Gemini, and discover the career opportunities and skills needed to succeed in this fast-evolving indust
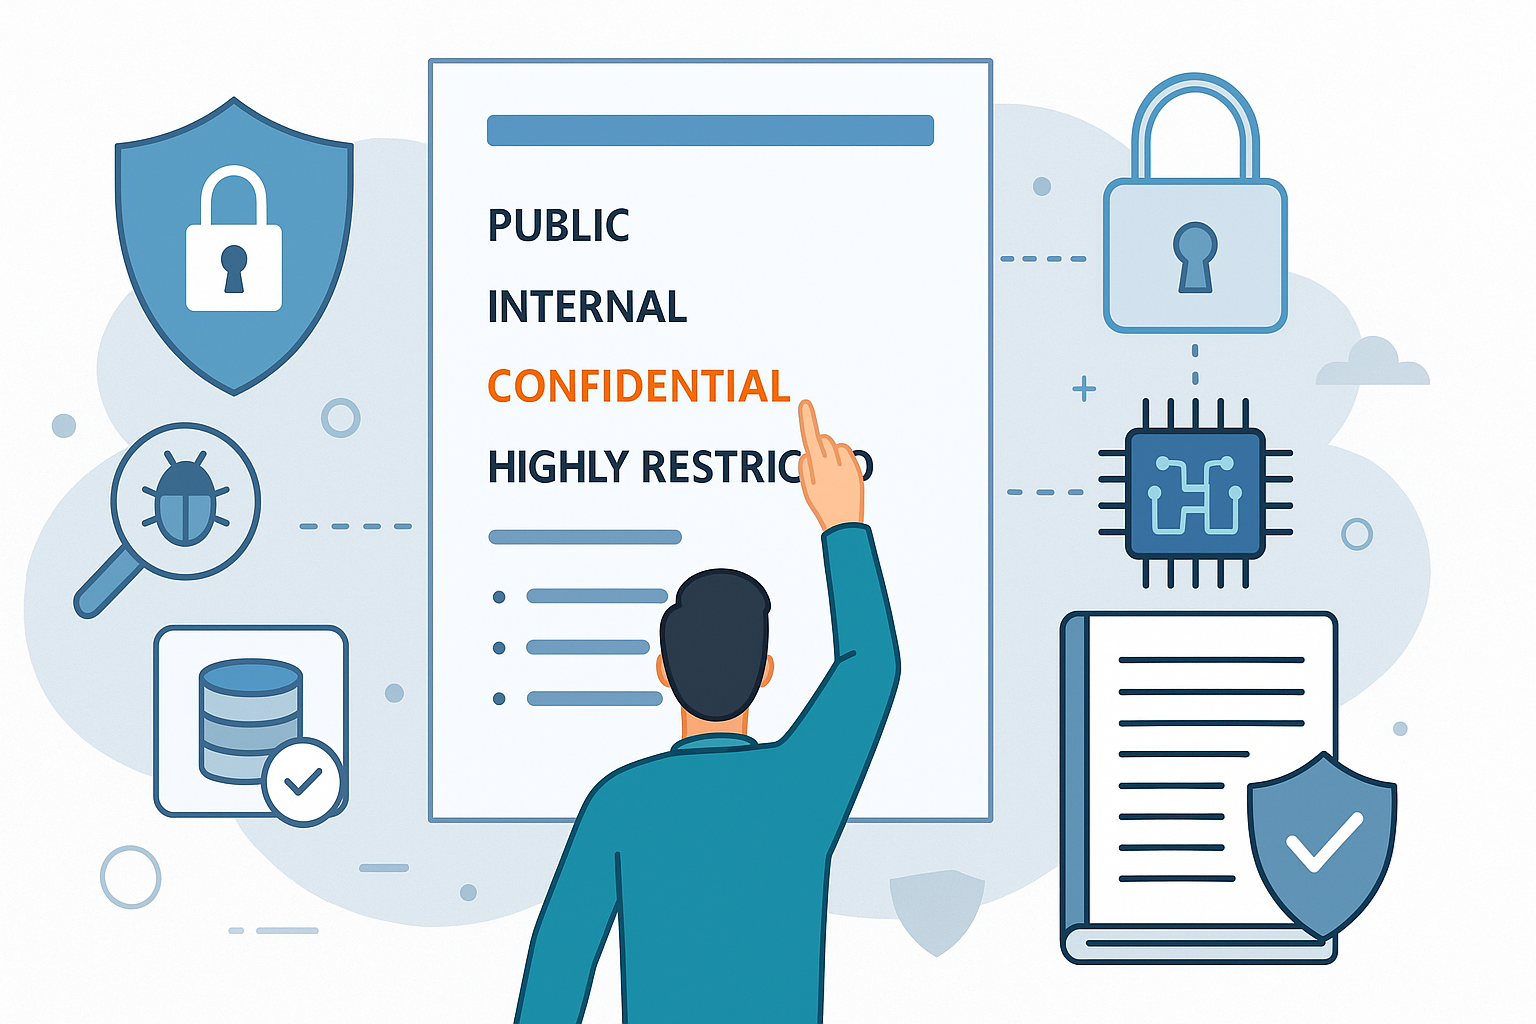
How Security Classification Guides Strengthen Data Protection in Modern Cybersecurity
A Security Classification Guide (SCG) defines data protection standards, ensuring sensitive information is handled securely across all levels. By outlining confidentiality, access controls, and declassification procedures, SCGs strengthen cybersecuri

Artificial Intelligence – A Growing Field of Study for Modern Learners
Artificial Intelligence is becoming a top study choice due to high job demand and future scope. This blog explains key subjects, career opportunities, and a simple AI study roadmap to help beginners start learning and build a strong career in the AI
Java in 2026: Why This ‘Old’ Language Is Still Your Golden Ticket to a Tech Career (And Where to Learn It!
Think Java is old news? Think again! 90% of Fortune 500 companies (yes, including Google, Amazon, and Netflix) run on Java (Oracle, 2025). From Android apps to banking systems, Java is the backbone of tech—and Sulekha IT Services is your fast track t
From Student to AI Pro: What Does Prompt Engineering Entail and How Do You Start?
Learn what prompt engineering is, why it matters, and how students and professionals can start mastering AI tools like ChatGPT, Gemini, and Copilot.

Cyber Security in 2025: The Golden Ticket to a Future-Proof Career
Cyber security jobs are growing 35% faster than any other tech field (U.S. Bureau of Labor Statistics, 2024)—and the average salary is $100,000+ per year! In a world where data breaches cost businesses $4.45 million on average (IBM, 2024), cyber secu

SAP SD in 2025: Your Ticket to a High-Flying IT Career
In the fast-paced world of IT and enterprise software, SAP SD (Sales and Distribution) is the secret sauce that keeps businesses running smoothly. Whether it’s managing customer orders, pricing, shipping, or billing, SAP SD is the backbone of sales o

SAP FICO in 2025: Salary, Jobs & How to Get Certified
AP FICO professionals earn $90,000–$130,000/year in the USA and Canada—and demand is skyrocketing! If you’re eyeing a future-proof IT career, SAP FICO (Financial Accounting & Controlling) is your golden ticket. But where do you start? Sulekha IT Serv

Train Like an AI Engineer: The Smartest Career Move You’ll Make This Year!
Why AI Engineering Is the Hottest Skillset Right Now From self-driving cars to chatbots that sound eerily human, Artificial Intelligence is no longer science fiction — it’s the backbone of modern tech. And guess what? Companies across the USA and Can
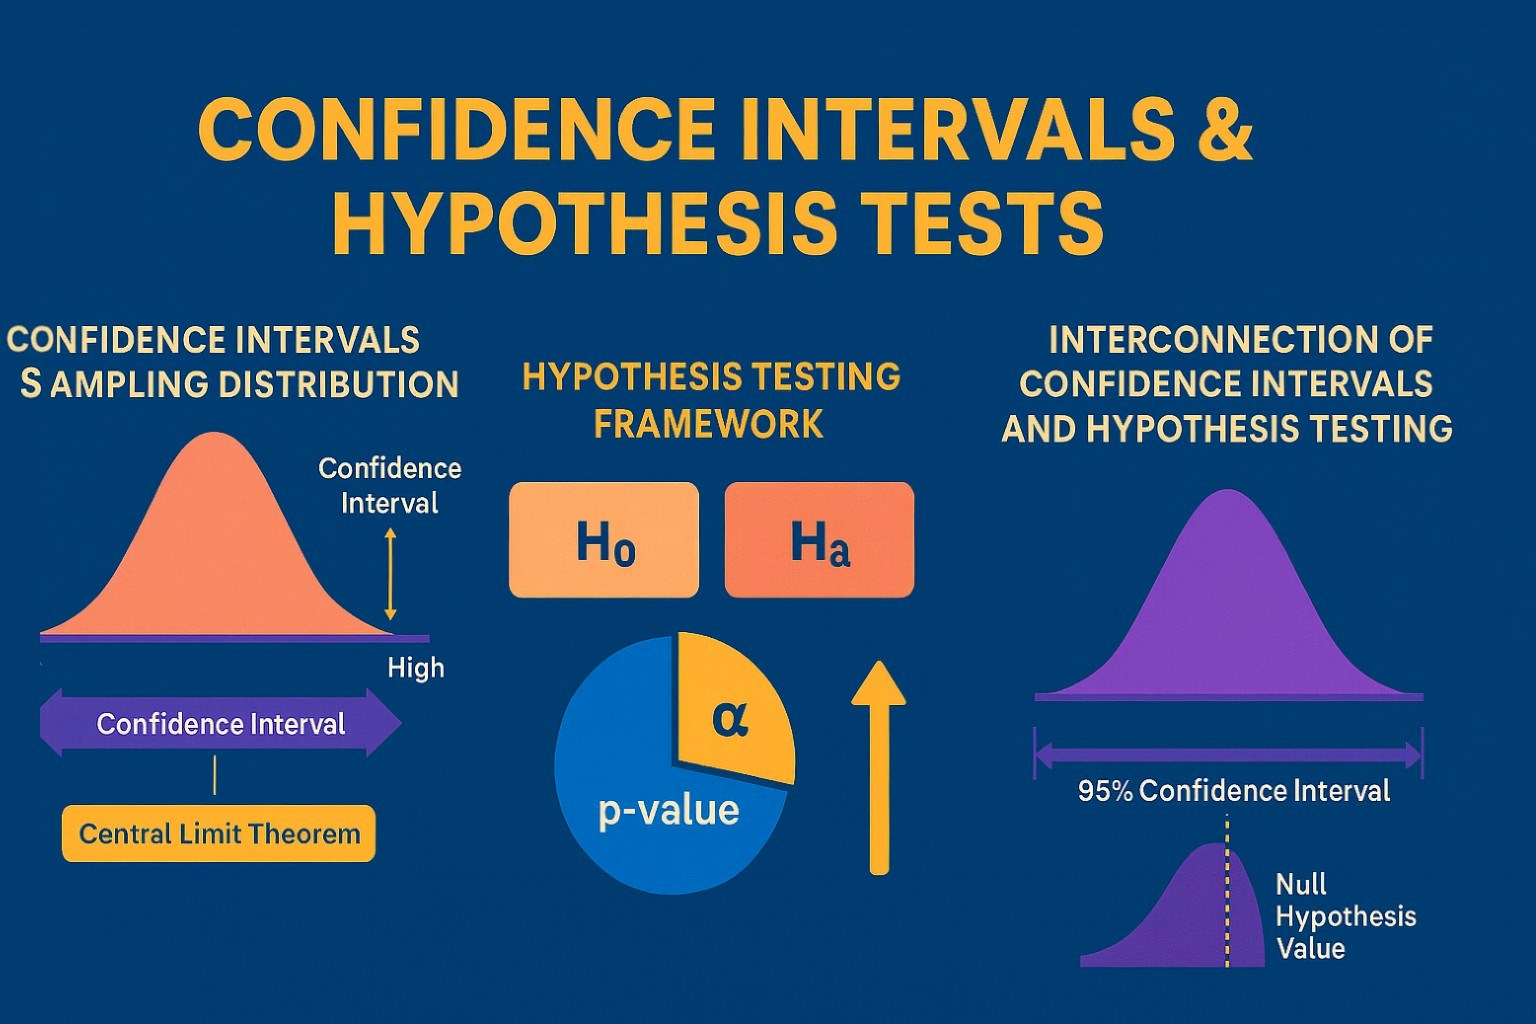
Confidence Intervals & Hypothesis Tests: The Data Science Path to Generalization
Learn how confidence intervals and hypothesis tests turn sample data into reliable population insights in data science. Understand CLT, p-values, and significance to generalize results, quantify uncertainty, and make evidence-based decisions.